
How did we reduce friction by 48% and increased conversions while simplifying complex decisions?

Finder
File
Edit
View
Go
Window
Help


seguroscencosud.cl


16:05
The Real Problem

Why would anyone want to see 34 nearly identical insurance options on their phone?”
This was my first question when I joined the team. The car insurance website had an 80% abandonment rate on the results page. Users saw 34 nearly identical options on mobile screens and left. It was obvious something was wrong, but nobody knew exactly what.
My Methodology: Service Design + Design Thinking
1. Empathize: Research Beyond the Numbers
Instead of just looking at analytics, I applied a Service Design approach to understand the entire ecosystem:

Customer Journey Map
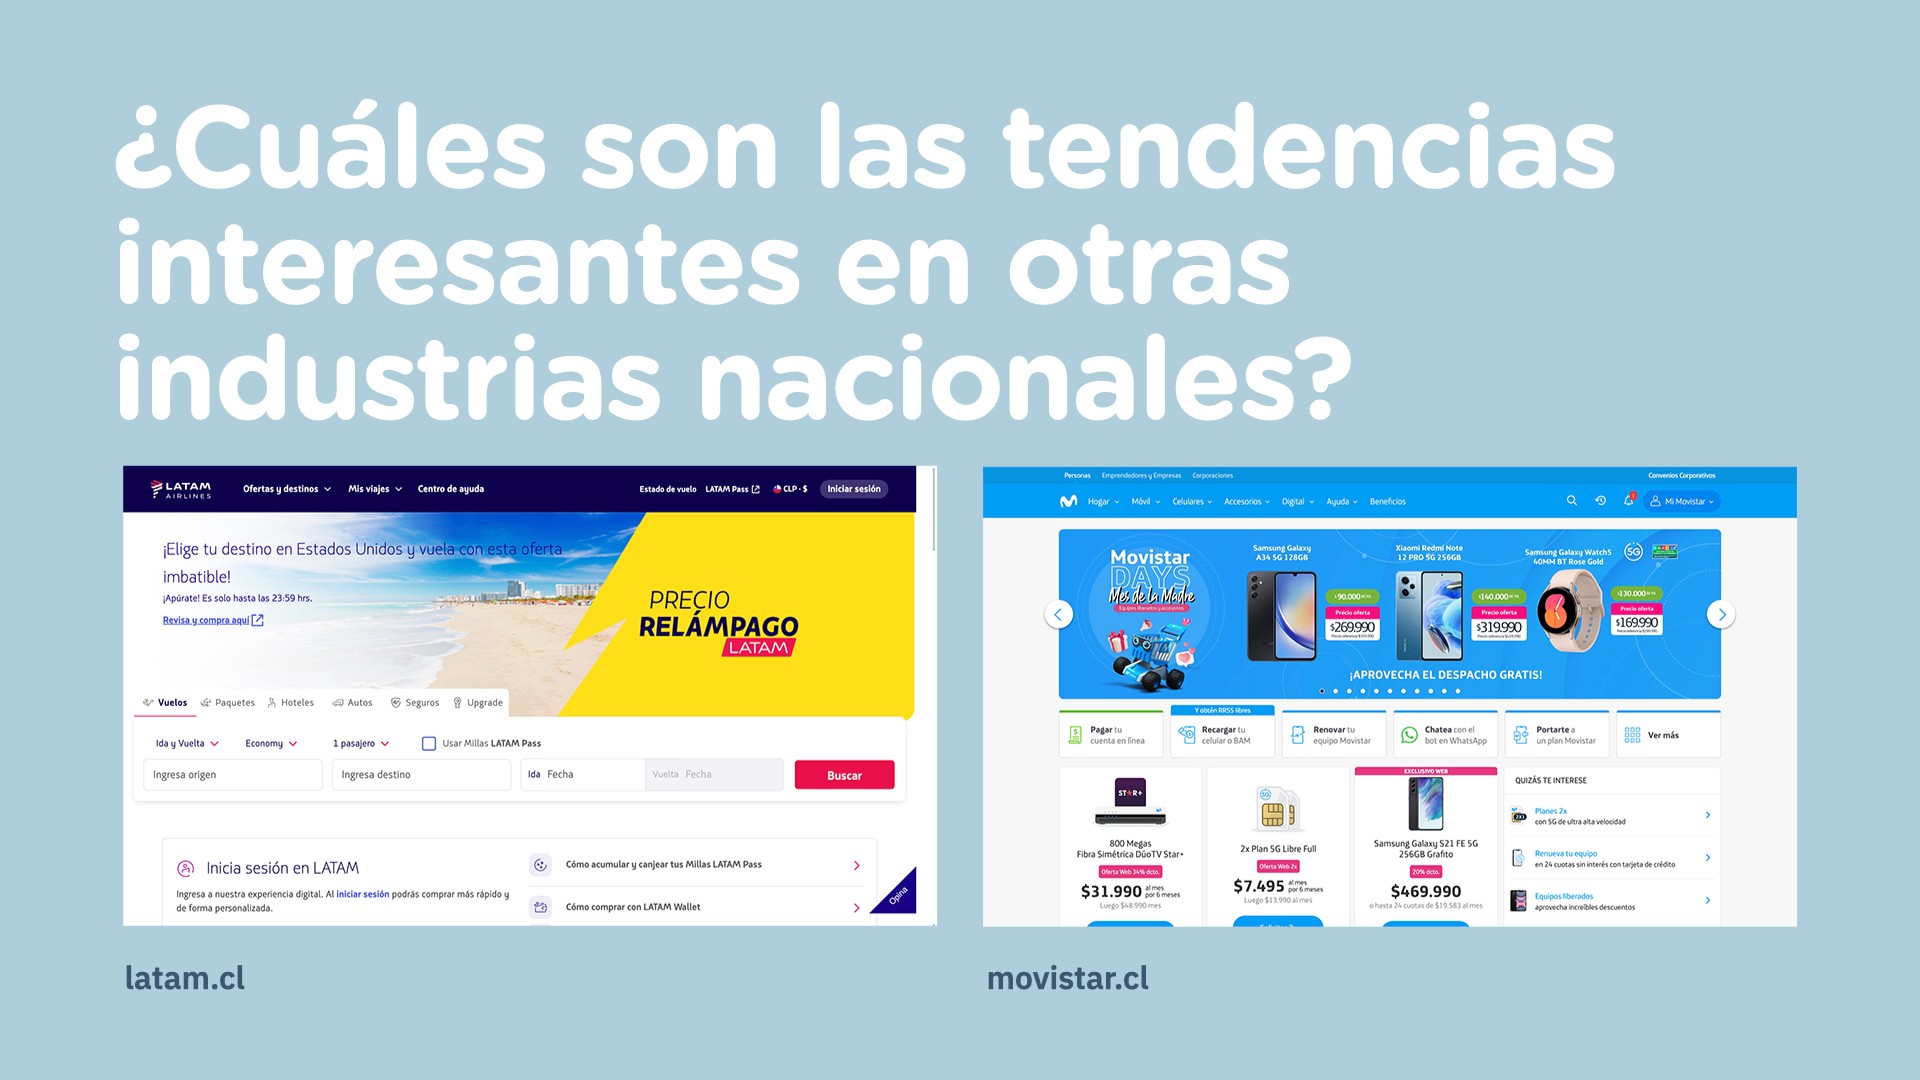
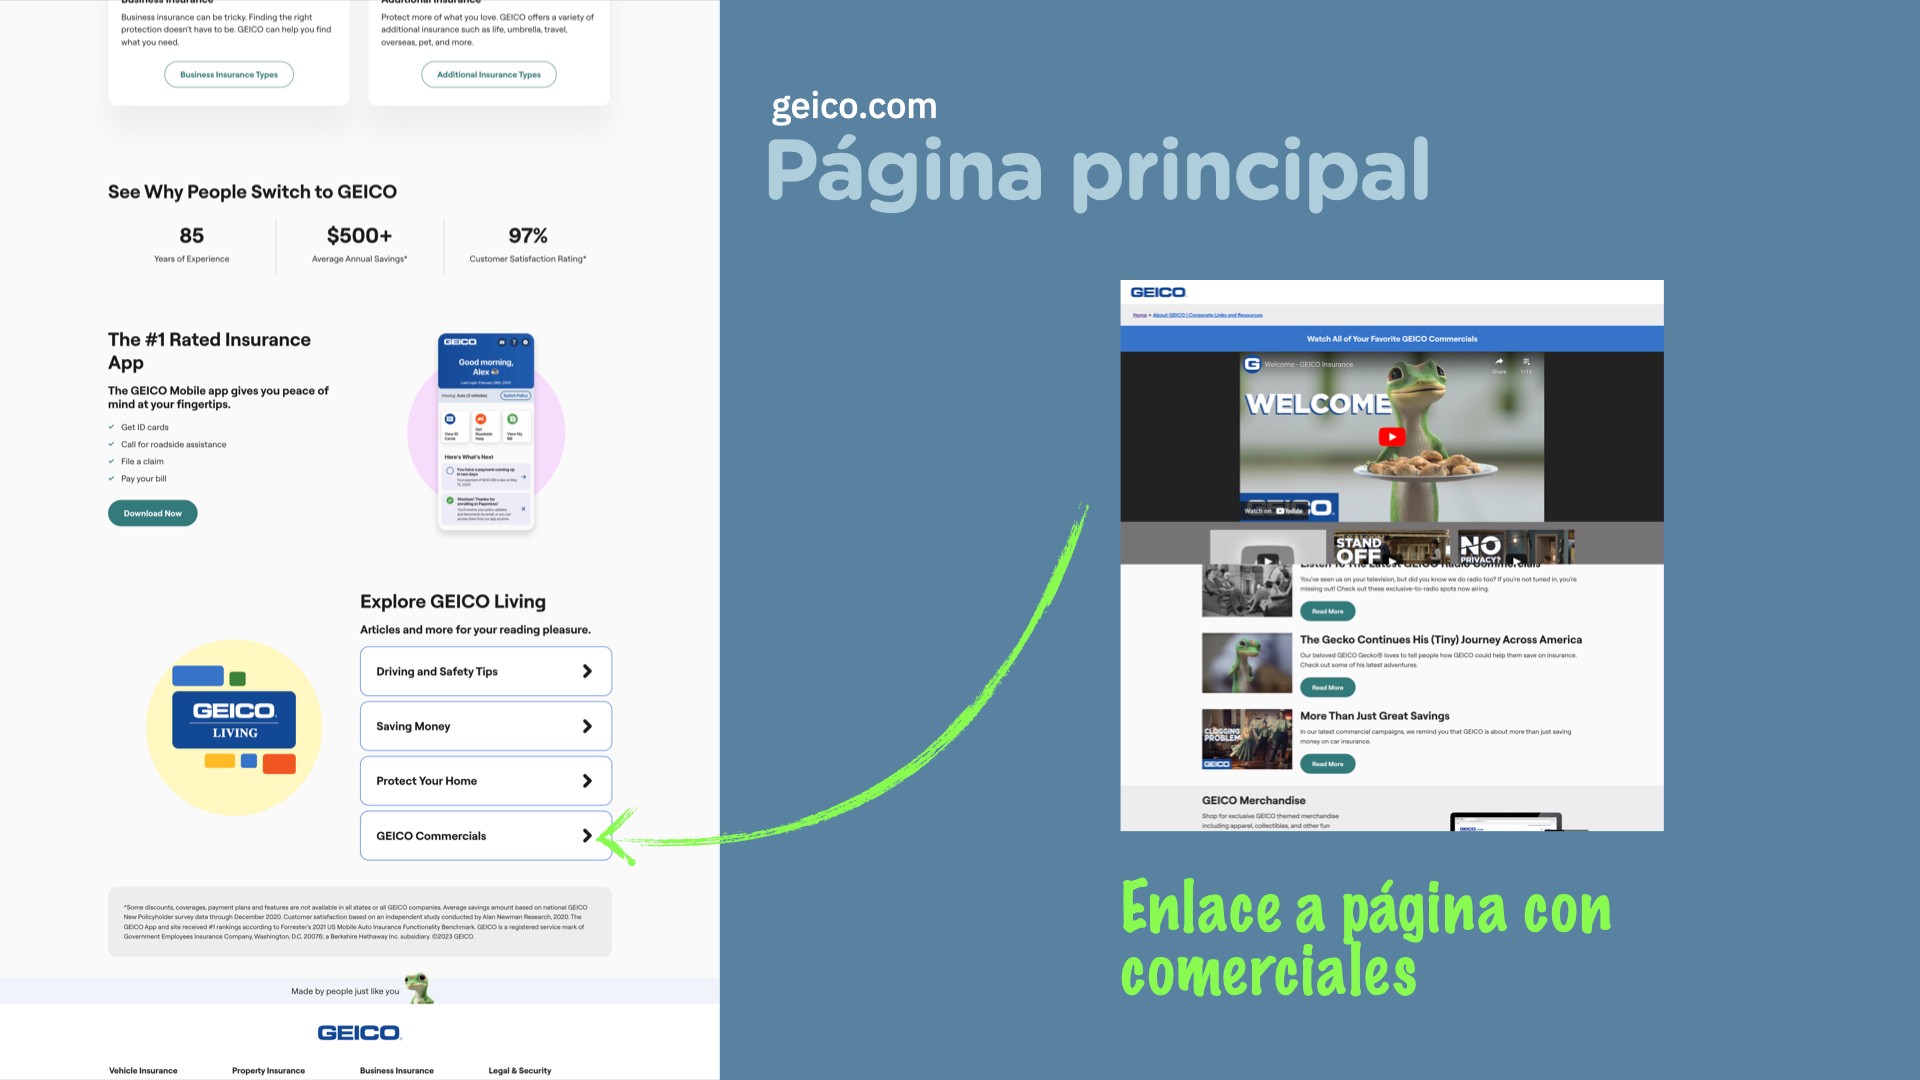
Competitive analysis
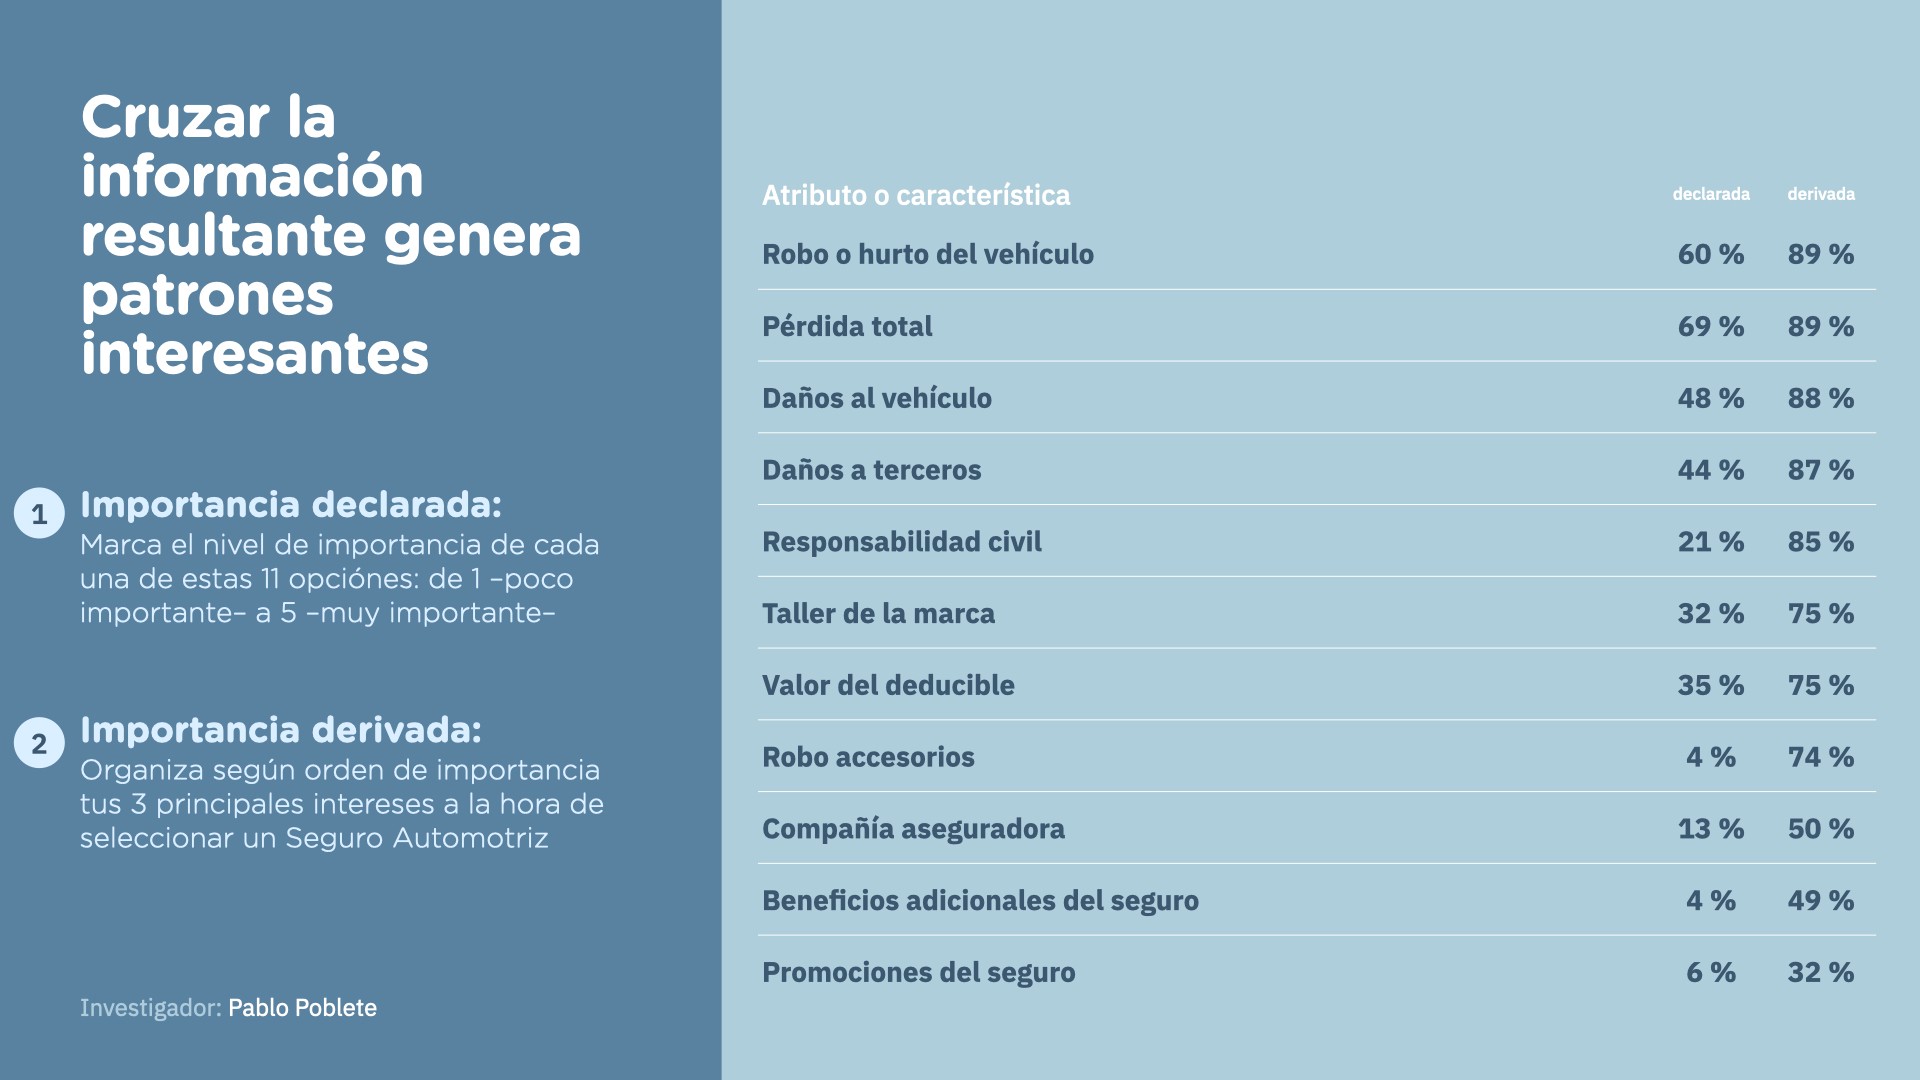
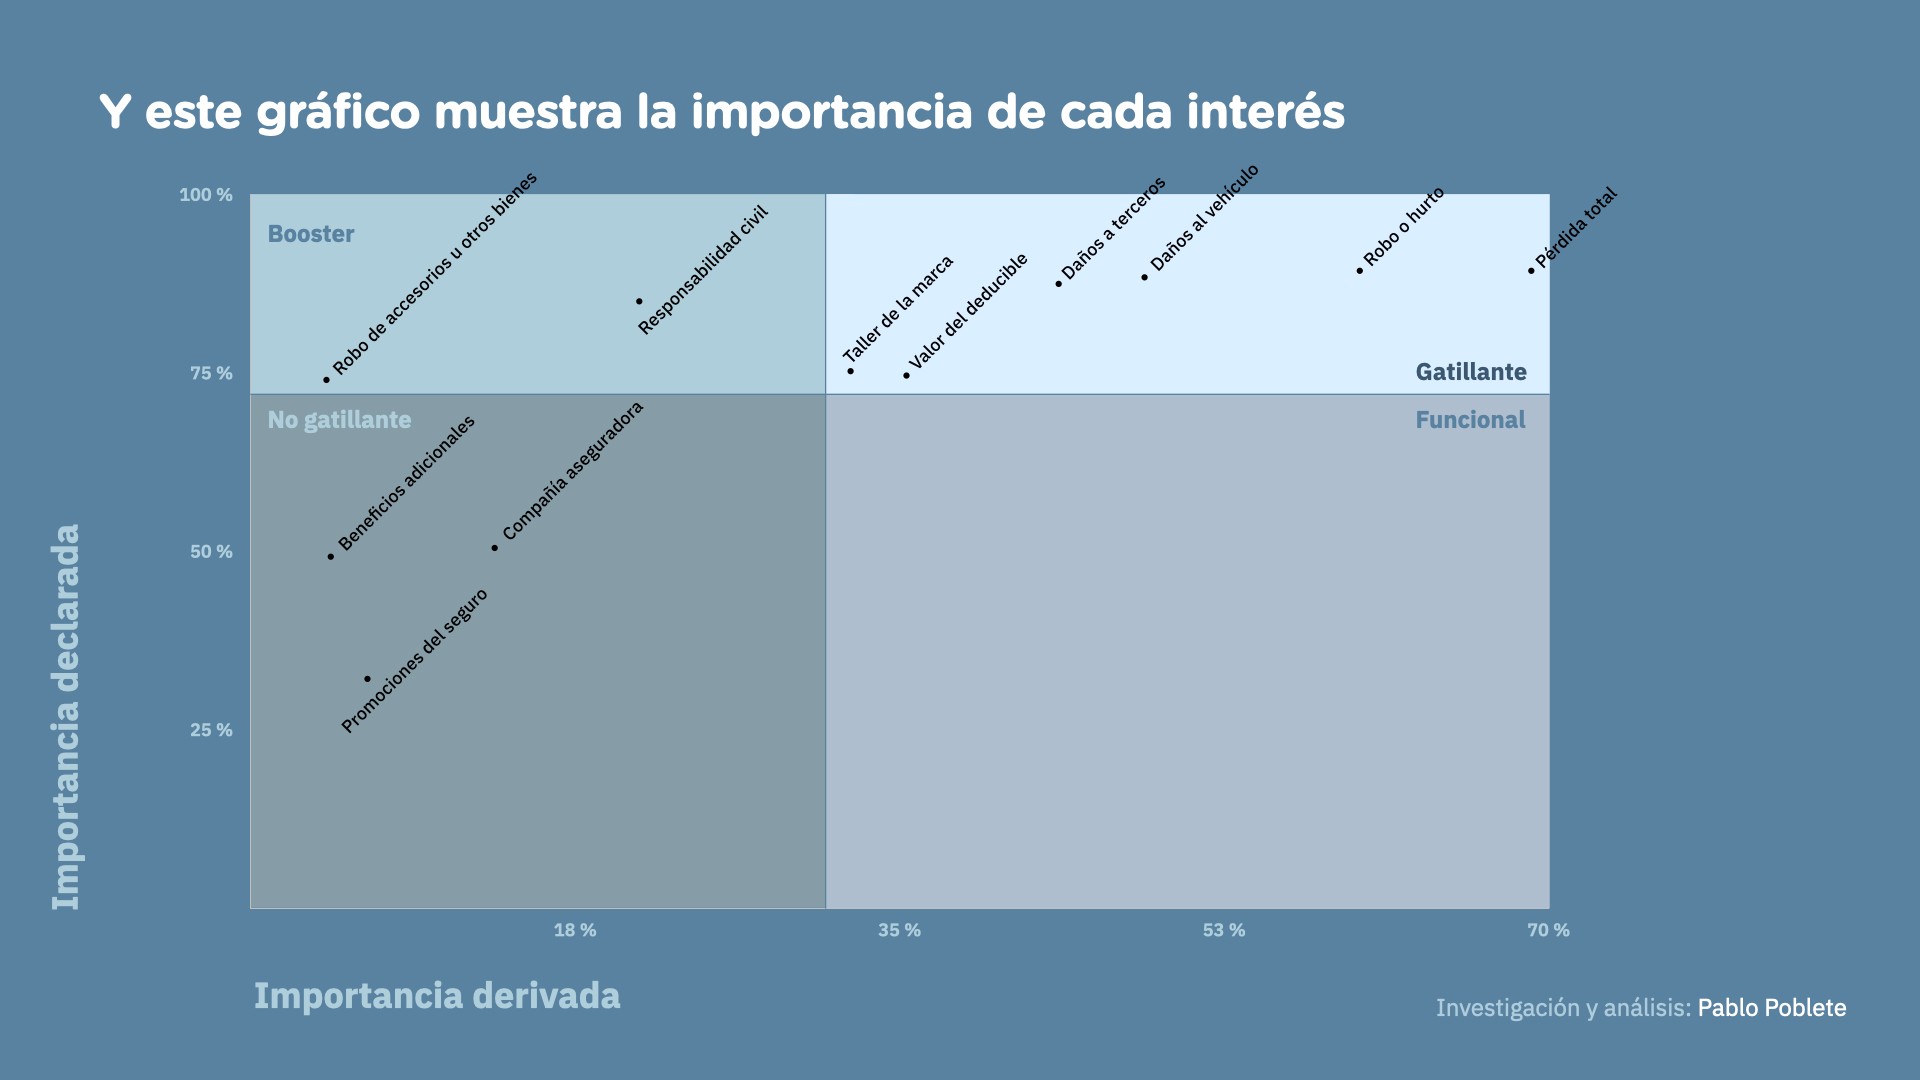
Mass surveys
In-depth interviews
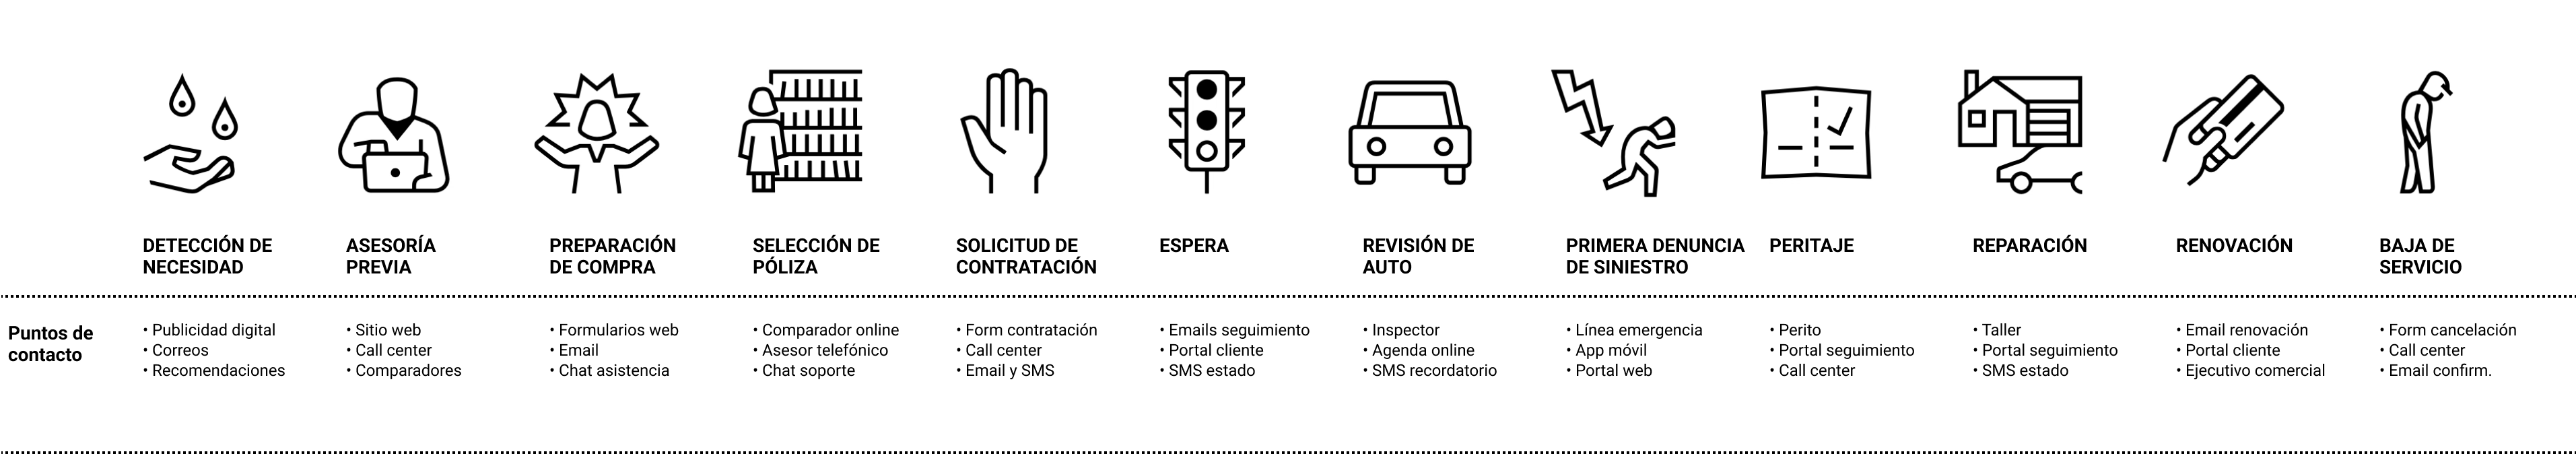
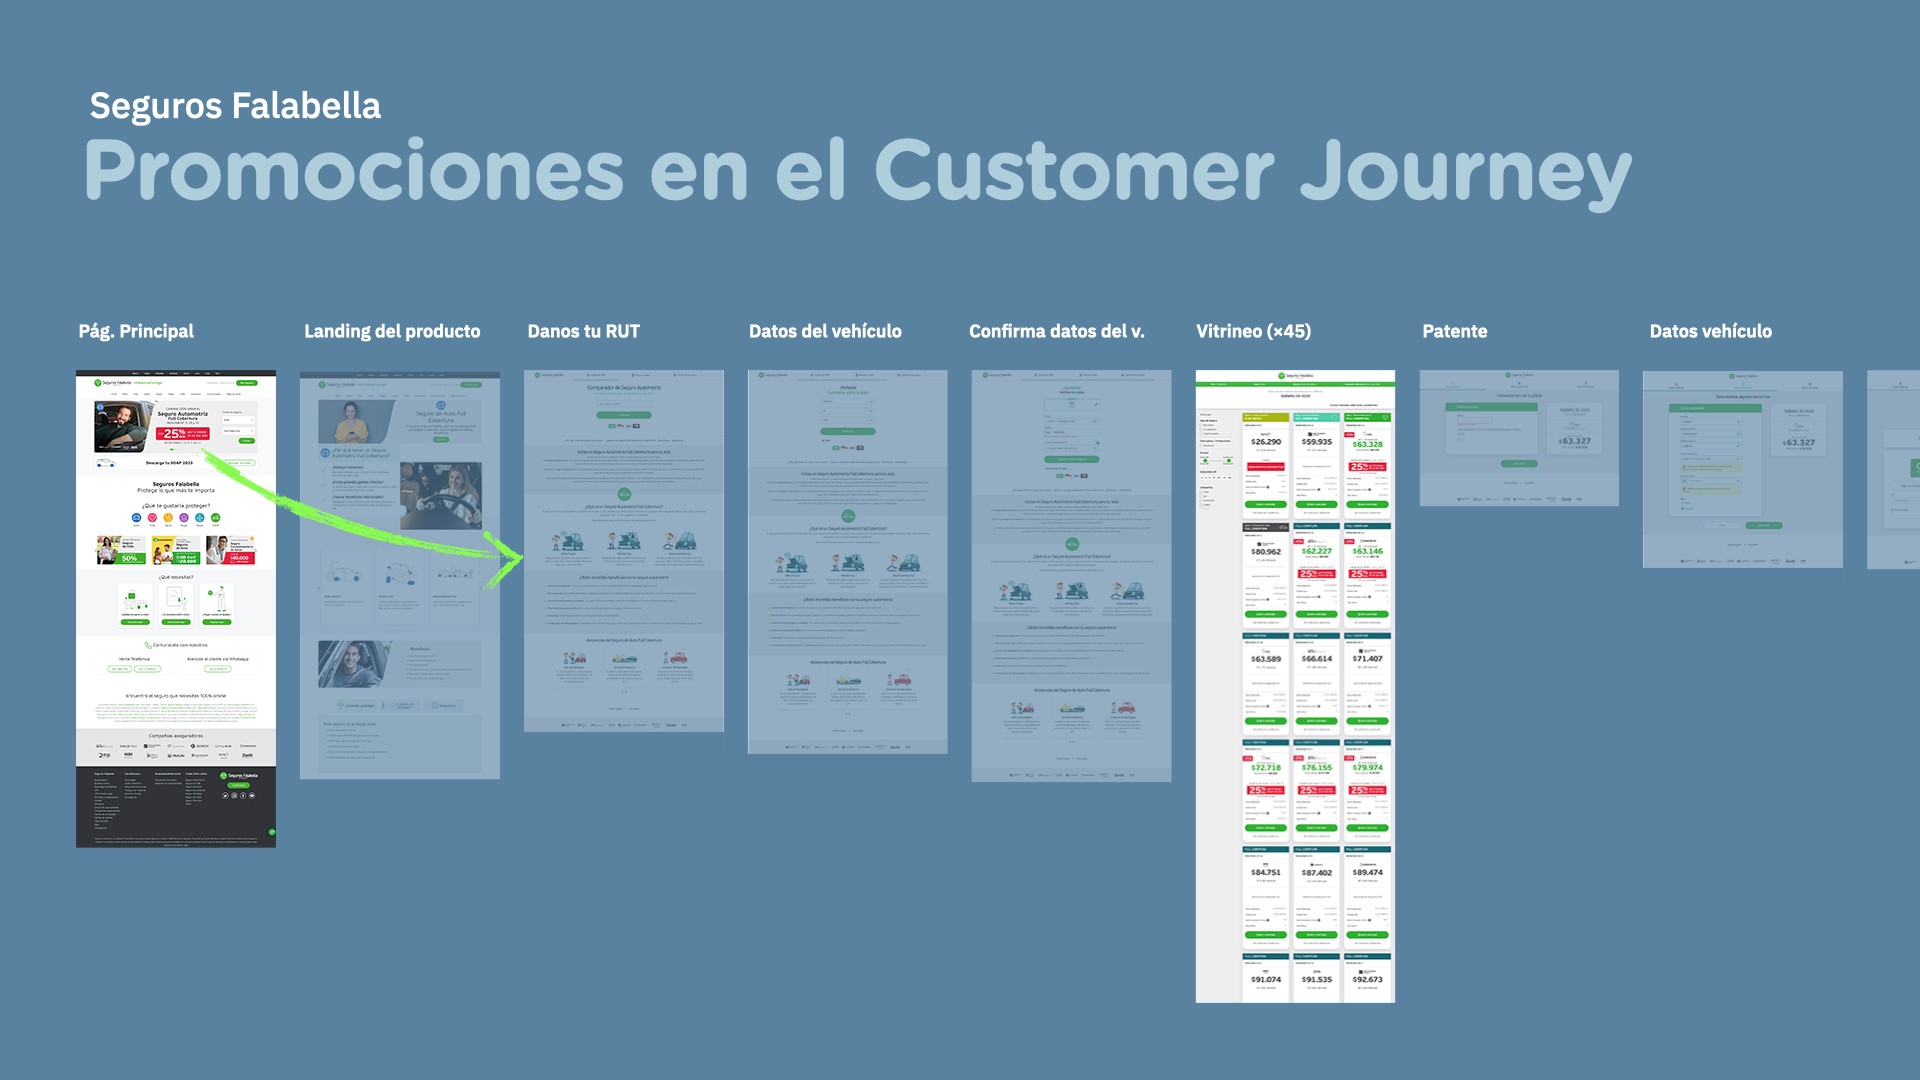
Complete Customer Journey Mapping
- Mapped the 11 key moments: from detecting the need to renewing or canceling
- Identified all touchpoints between the user and the company
- Discovered that other channels were competing for the same sale
Multifaceted Research
- Competitive analysis: 9 direct competitors + international references
- Mass surveys: 221 prospects + 337 current customers
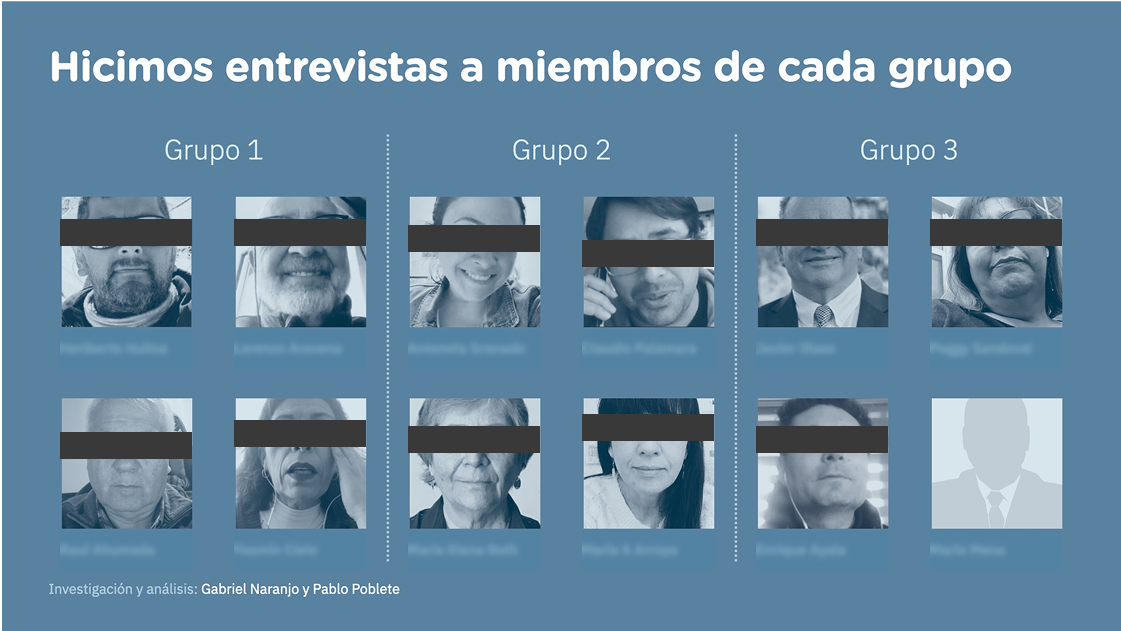
- In-depth interviews: 12 people to define archetypes
2. Define: Three User Types, Three Strategies
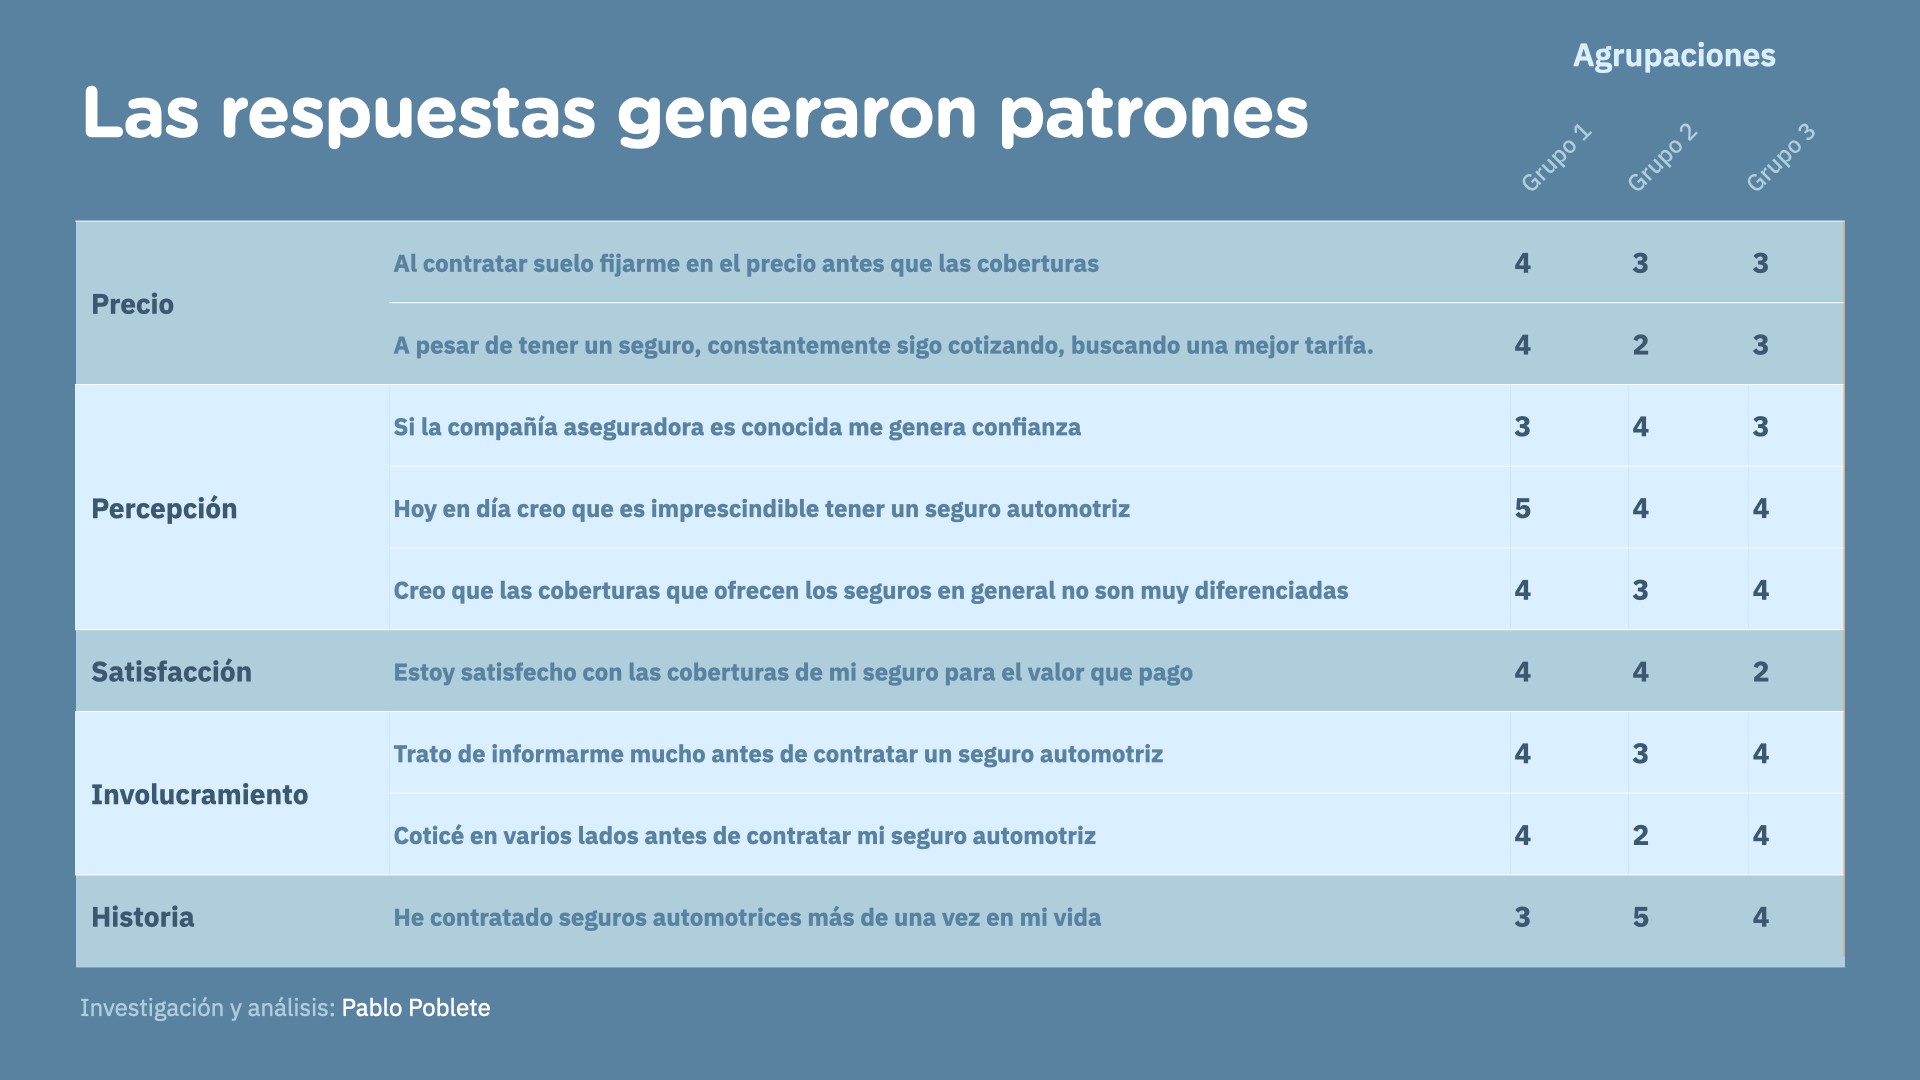
Three clear archetypes emerged from the research:
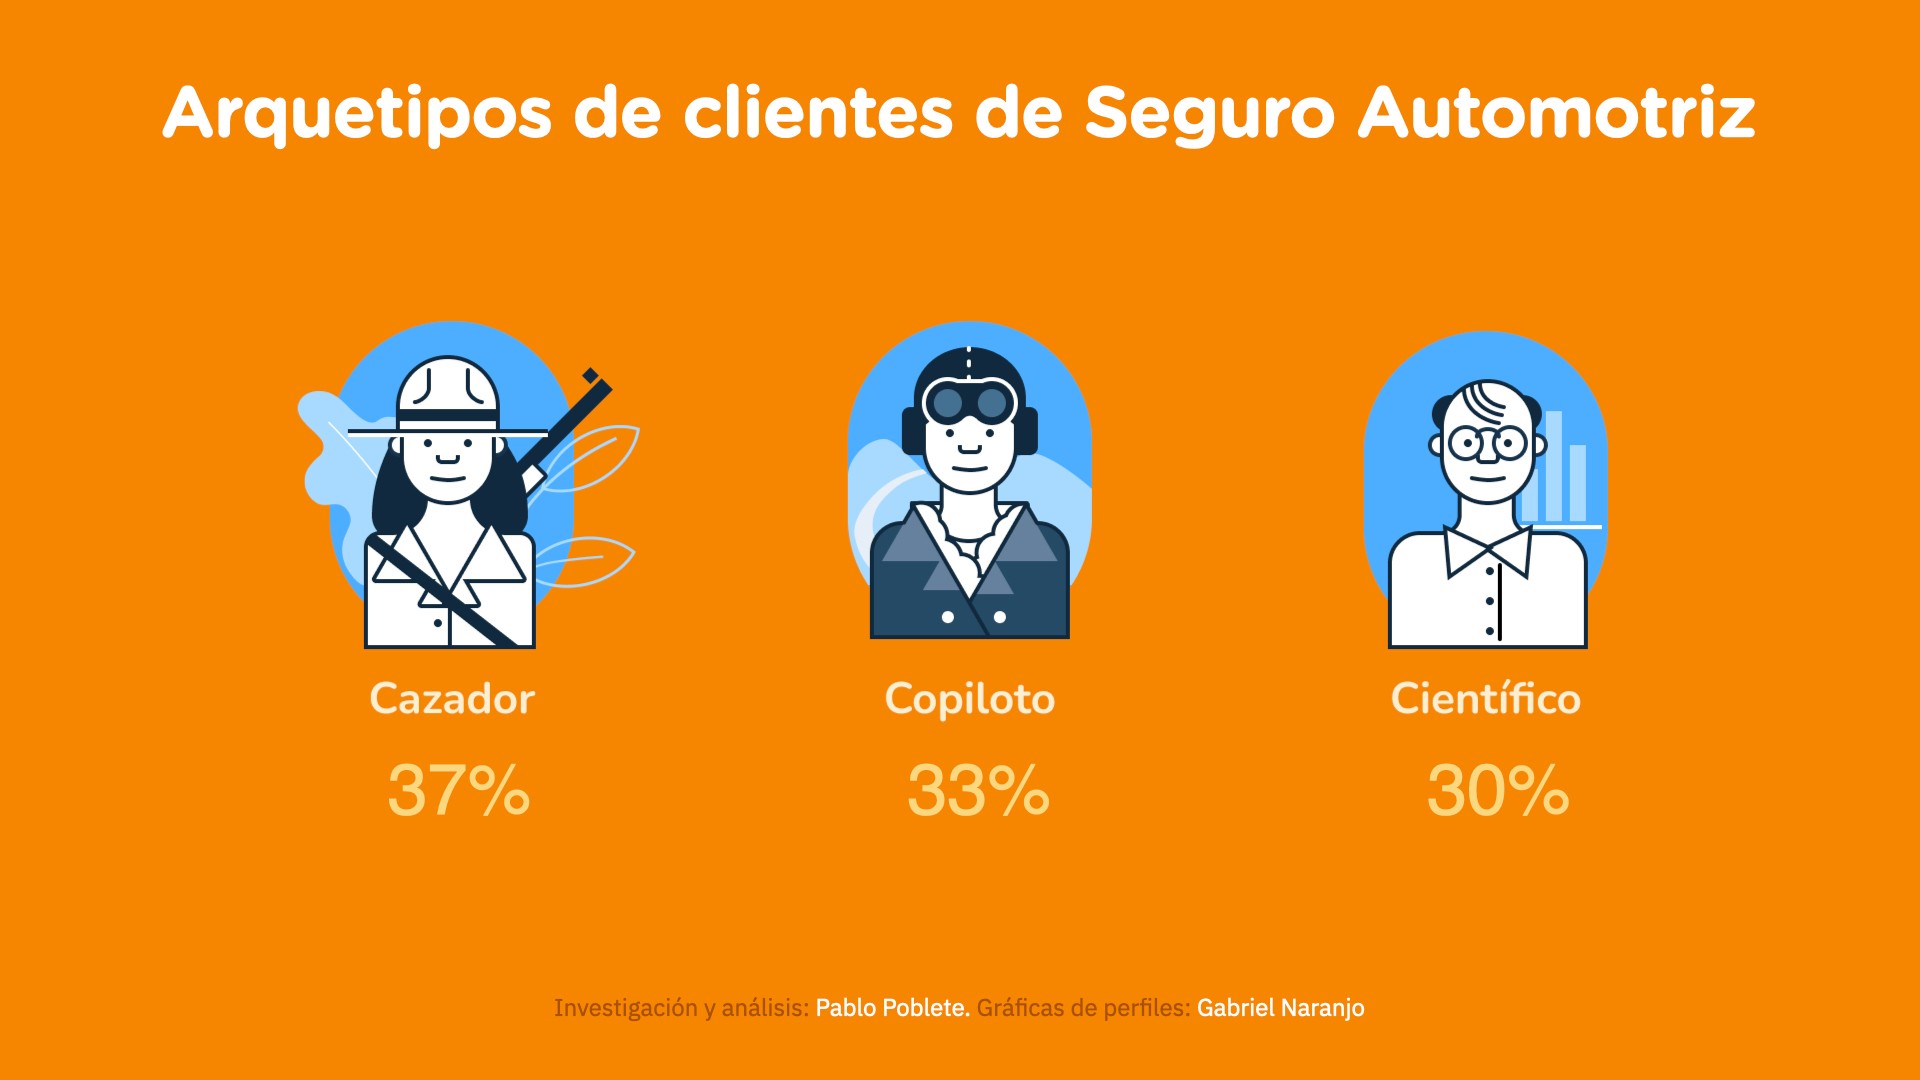
Archetypes definition
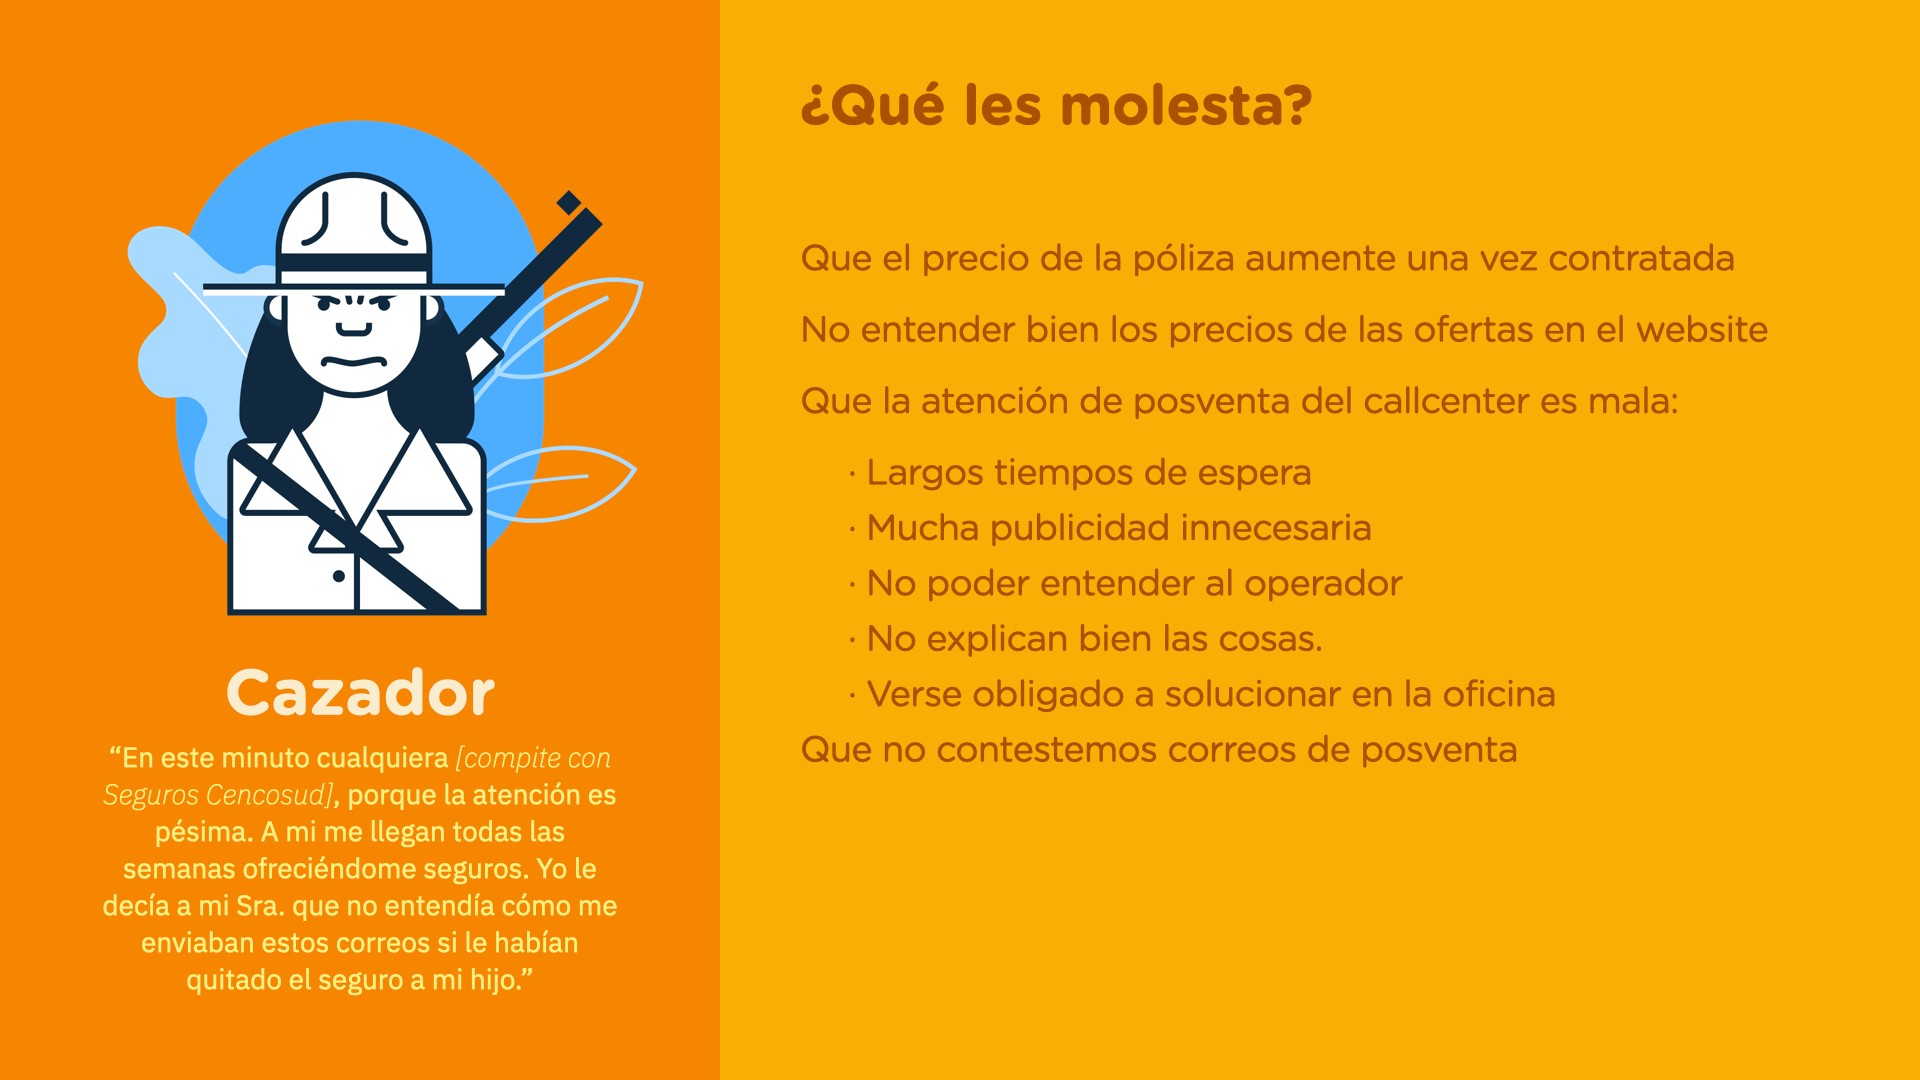
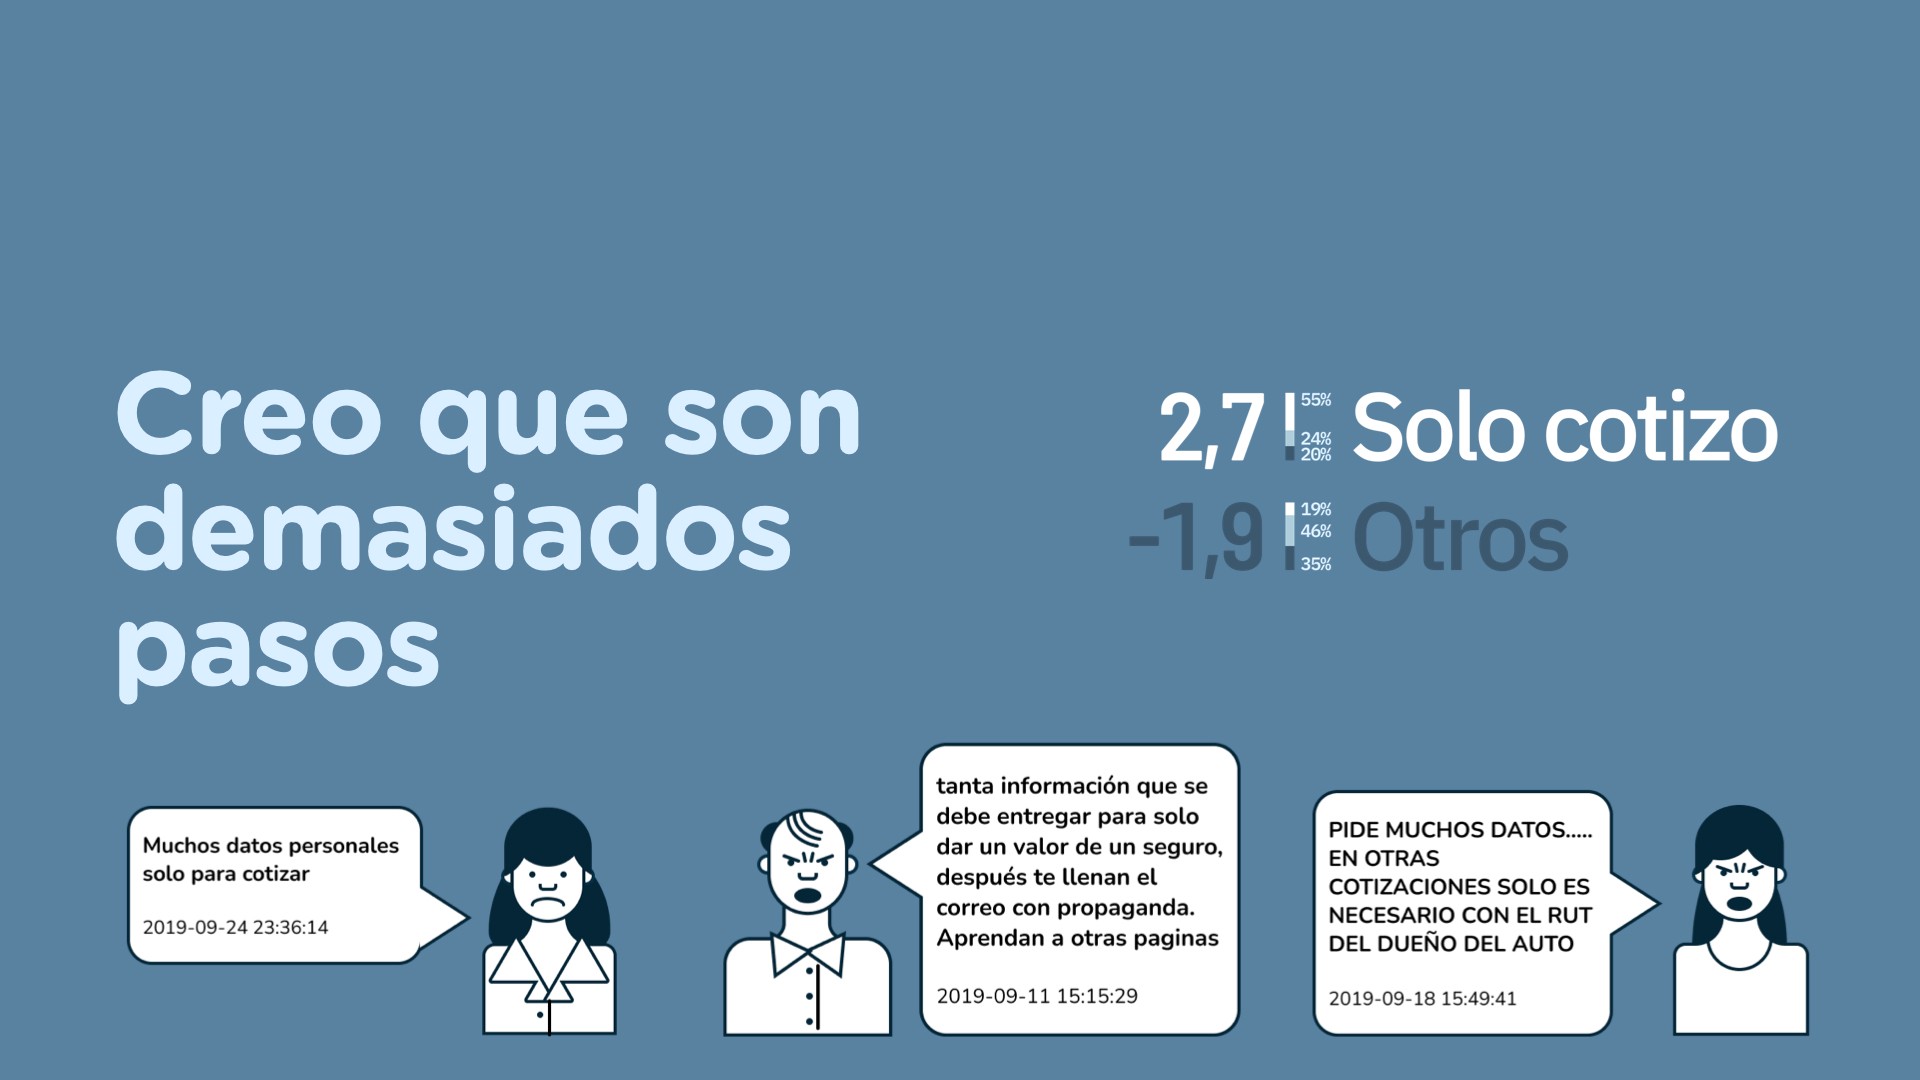
Pain points of the “hunter” archetype
- Hunters (48%): Only care about price and speed
- Copilots (30%): Seek security and confirmation
- Scientists (22%): Need to understand all the details
Each group had specific pain points that required different solutions.
3. Ideate: Objective Prioritization with RICE
To avoid subjective discussions about what to change first, I implemented the RICE framework:

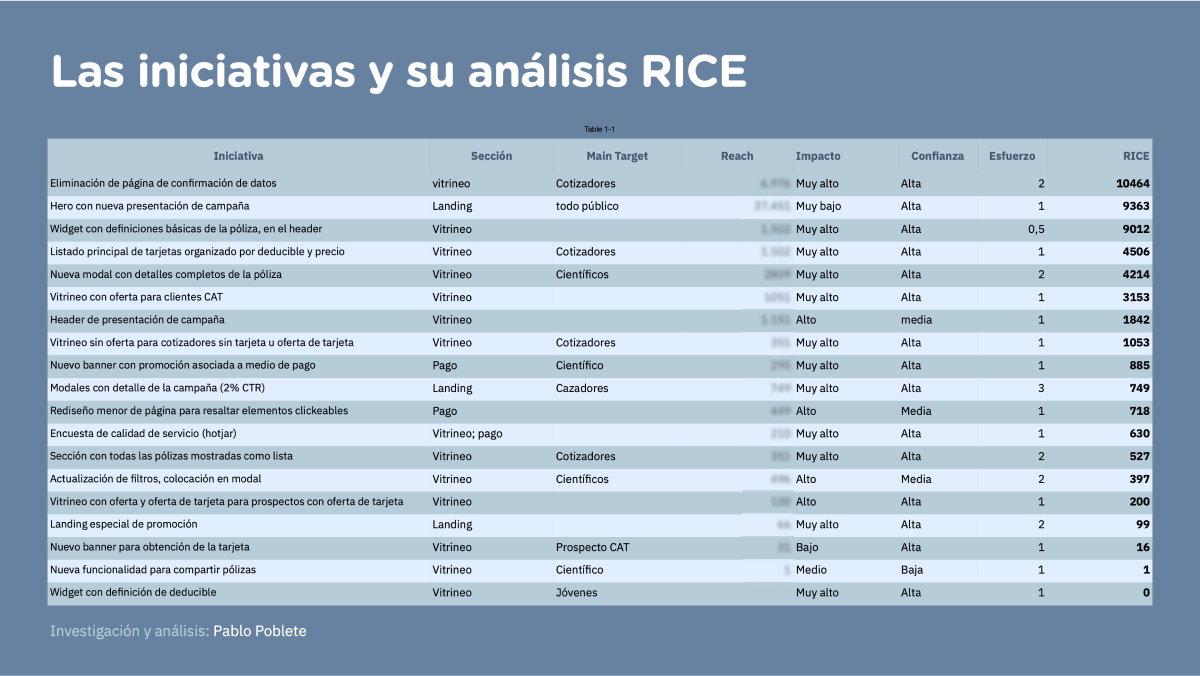
Initiatives analized with the RICE methodology
RICE = (Reach × Impact × Confidence) ÷ Effort
Result: 19 initiatives objectively prioritized, with “eliminating unnecessary screens” as issue #1 (RICE index: 10,464).
4. Prototype: Modular Solutions
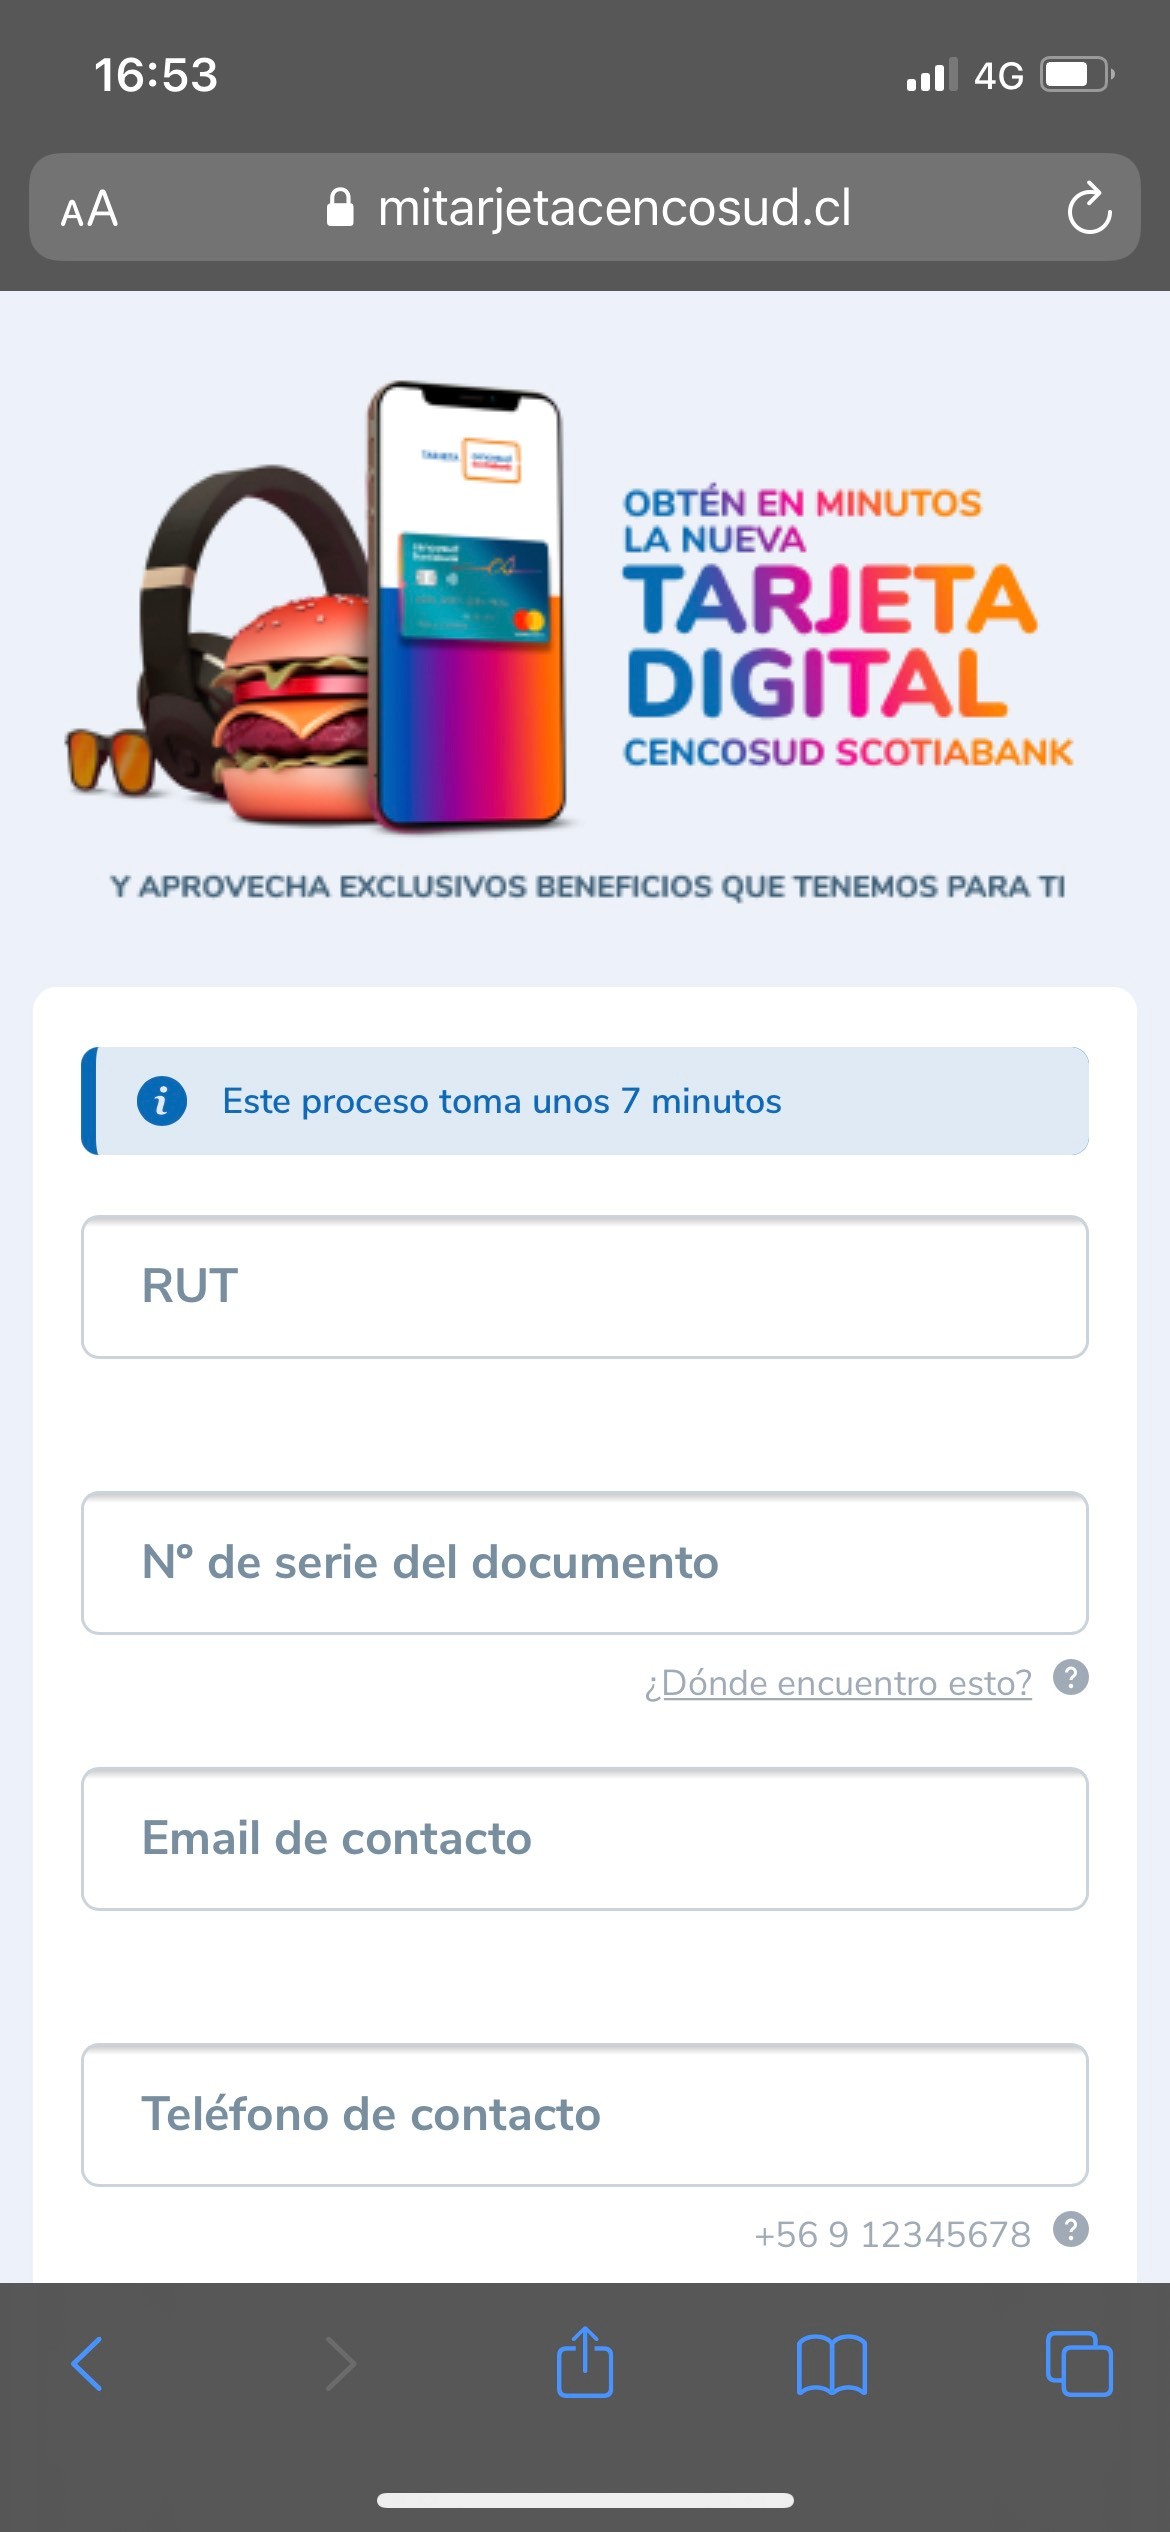
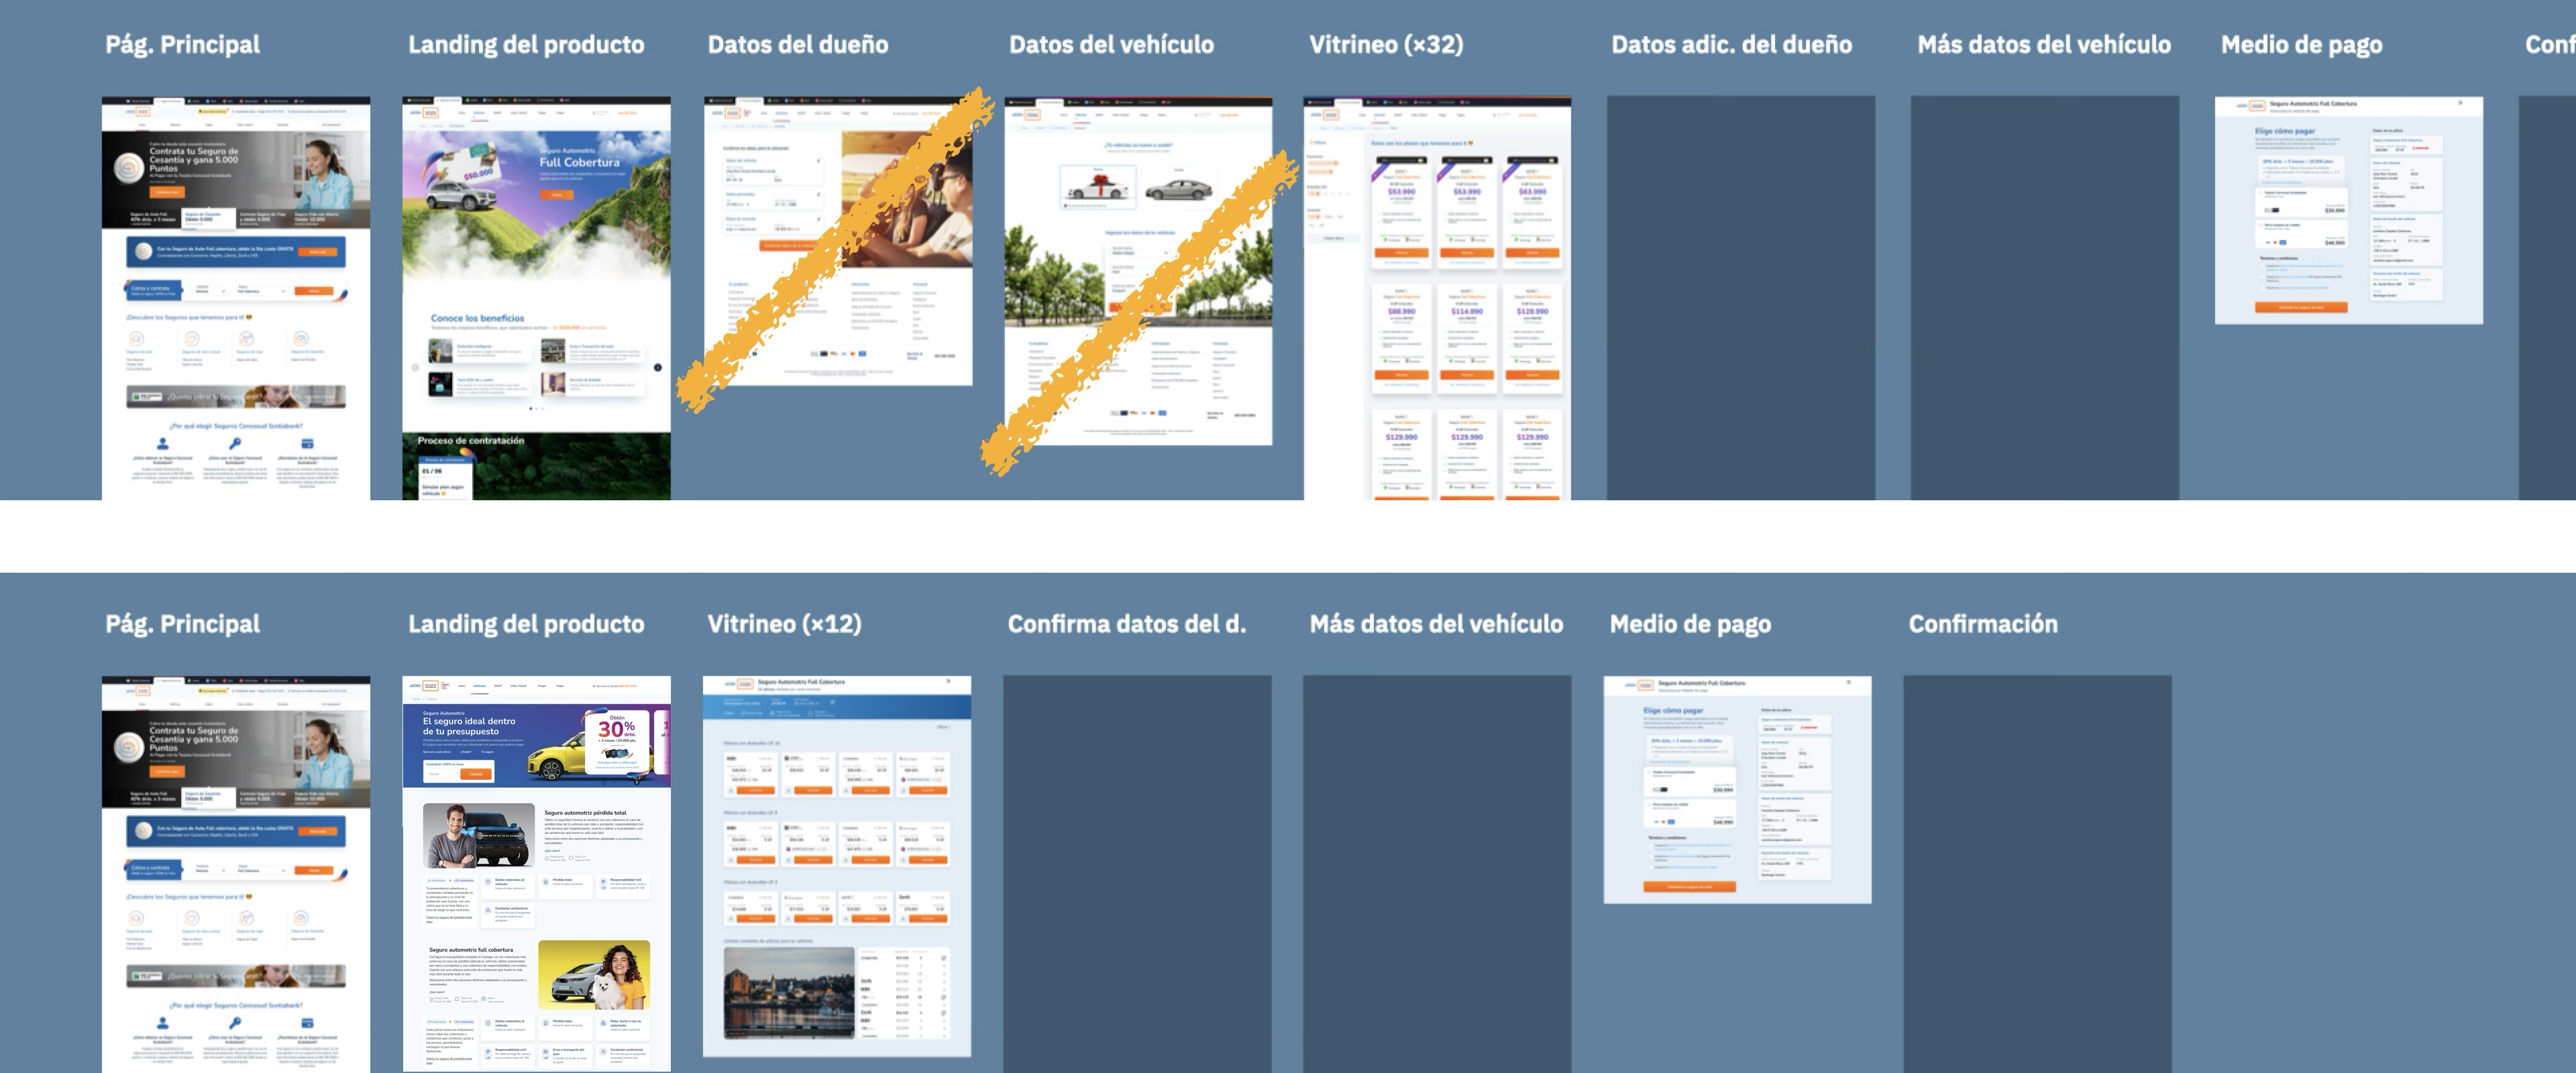
Solution 1: Simplified Flow (from 5 to 3 screens)
Adjustments to the flow
- Used license plate as starting point
- Only asked for additional data if not in database
- Impact: 48% reduction in friction
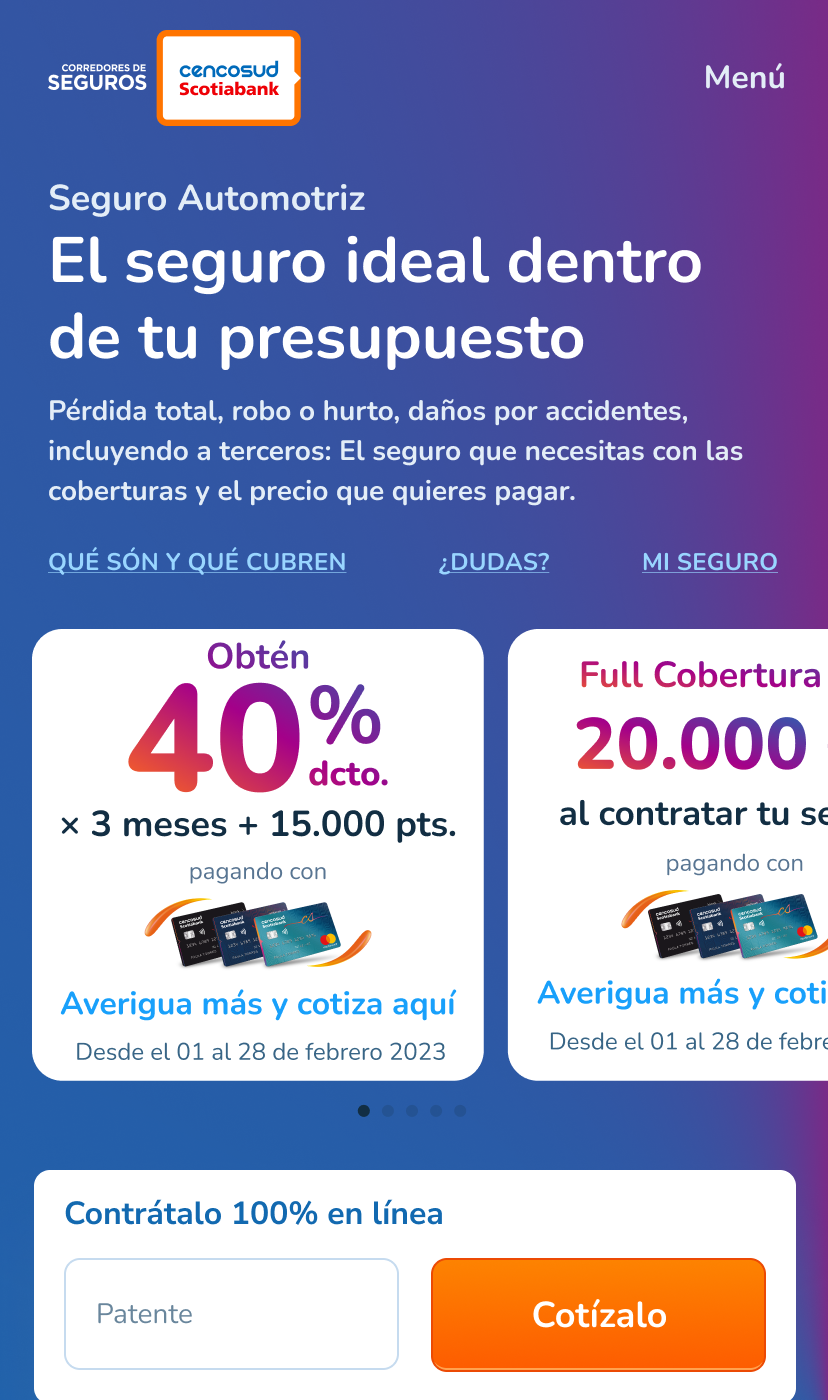
Solution 2: Hick's Law Applied (from 34 to 12 options)

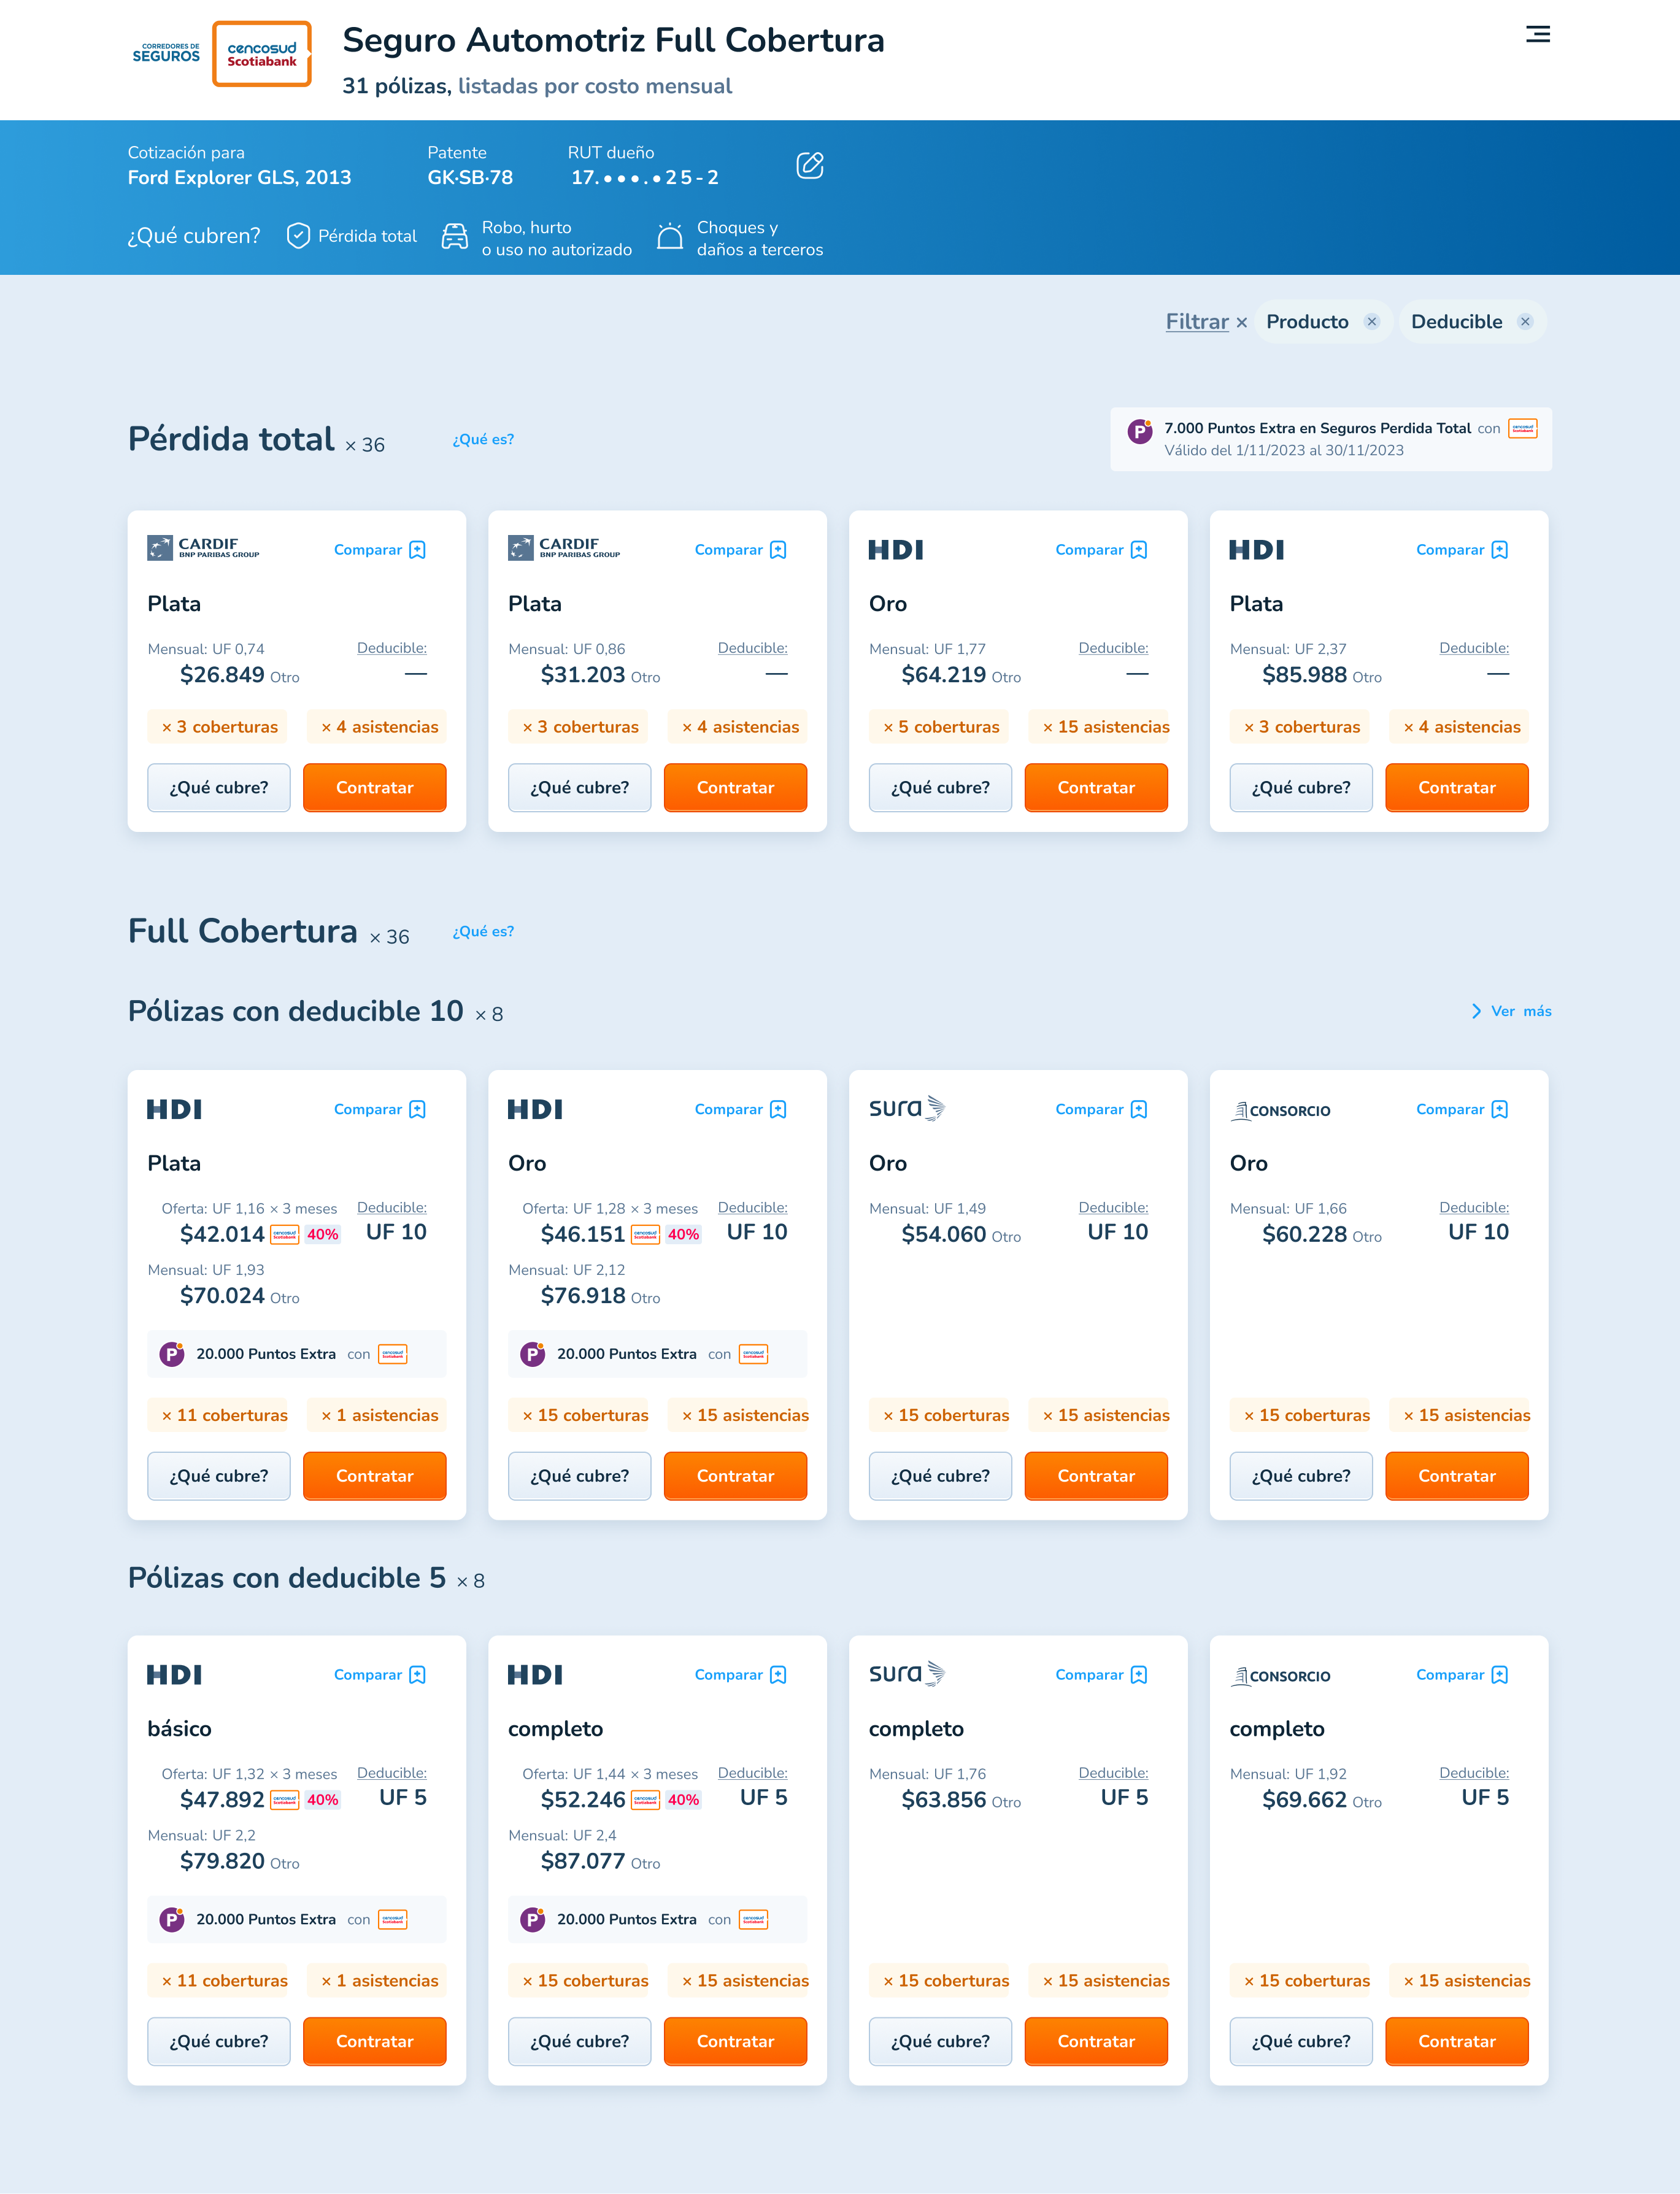
Desktop version
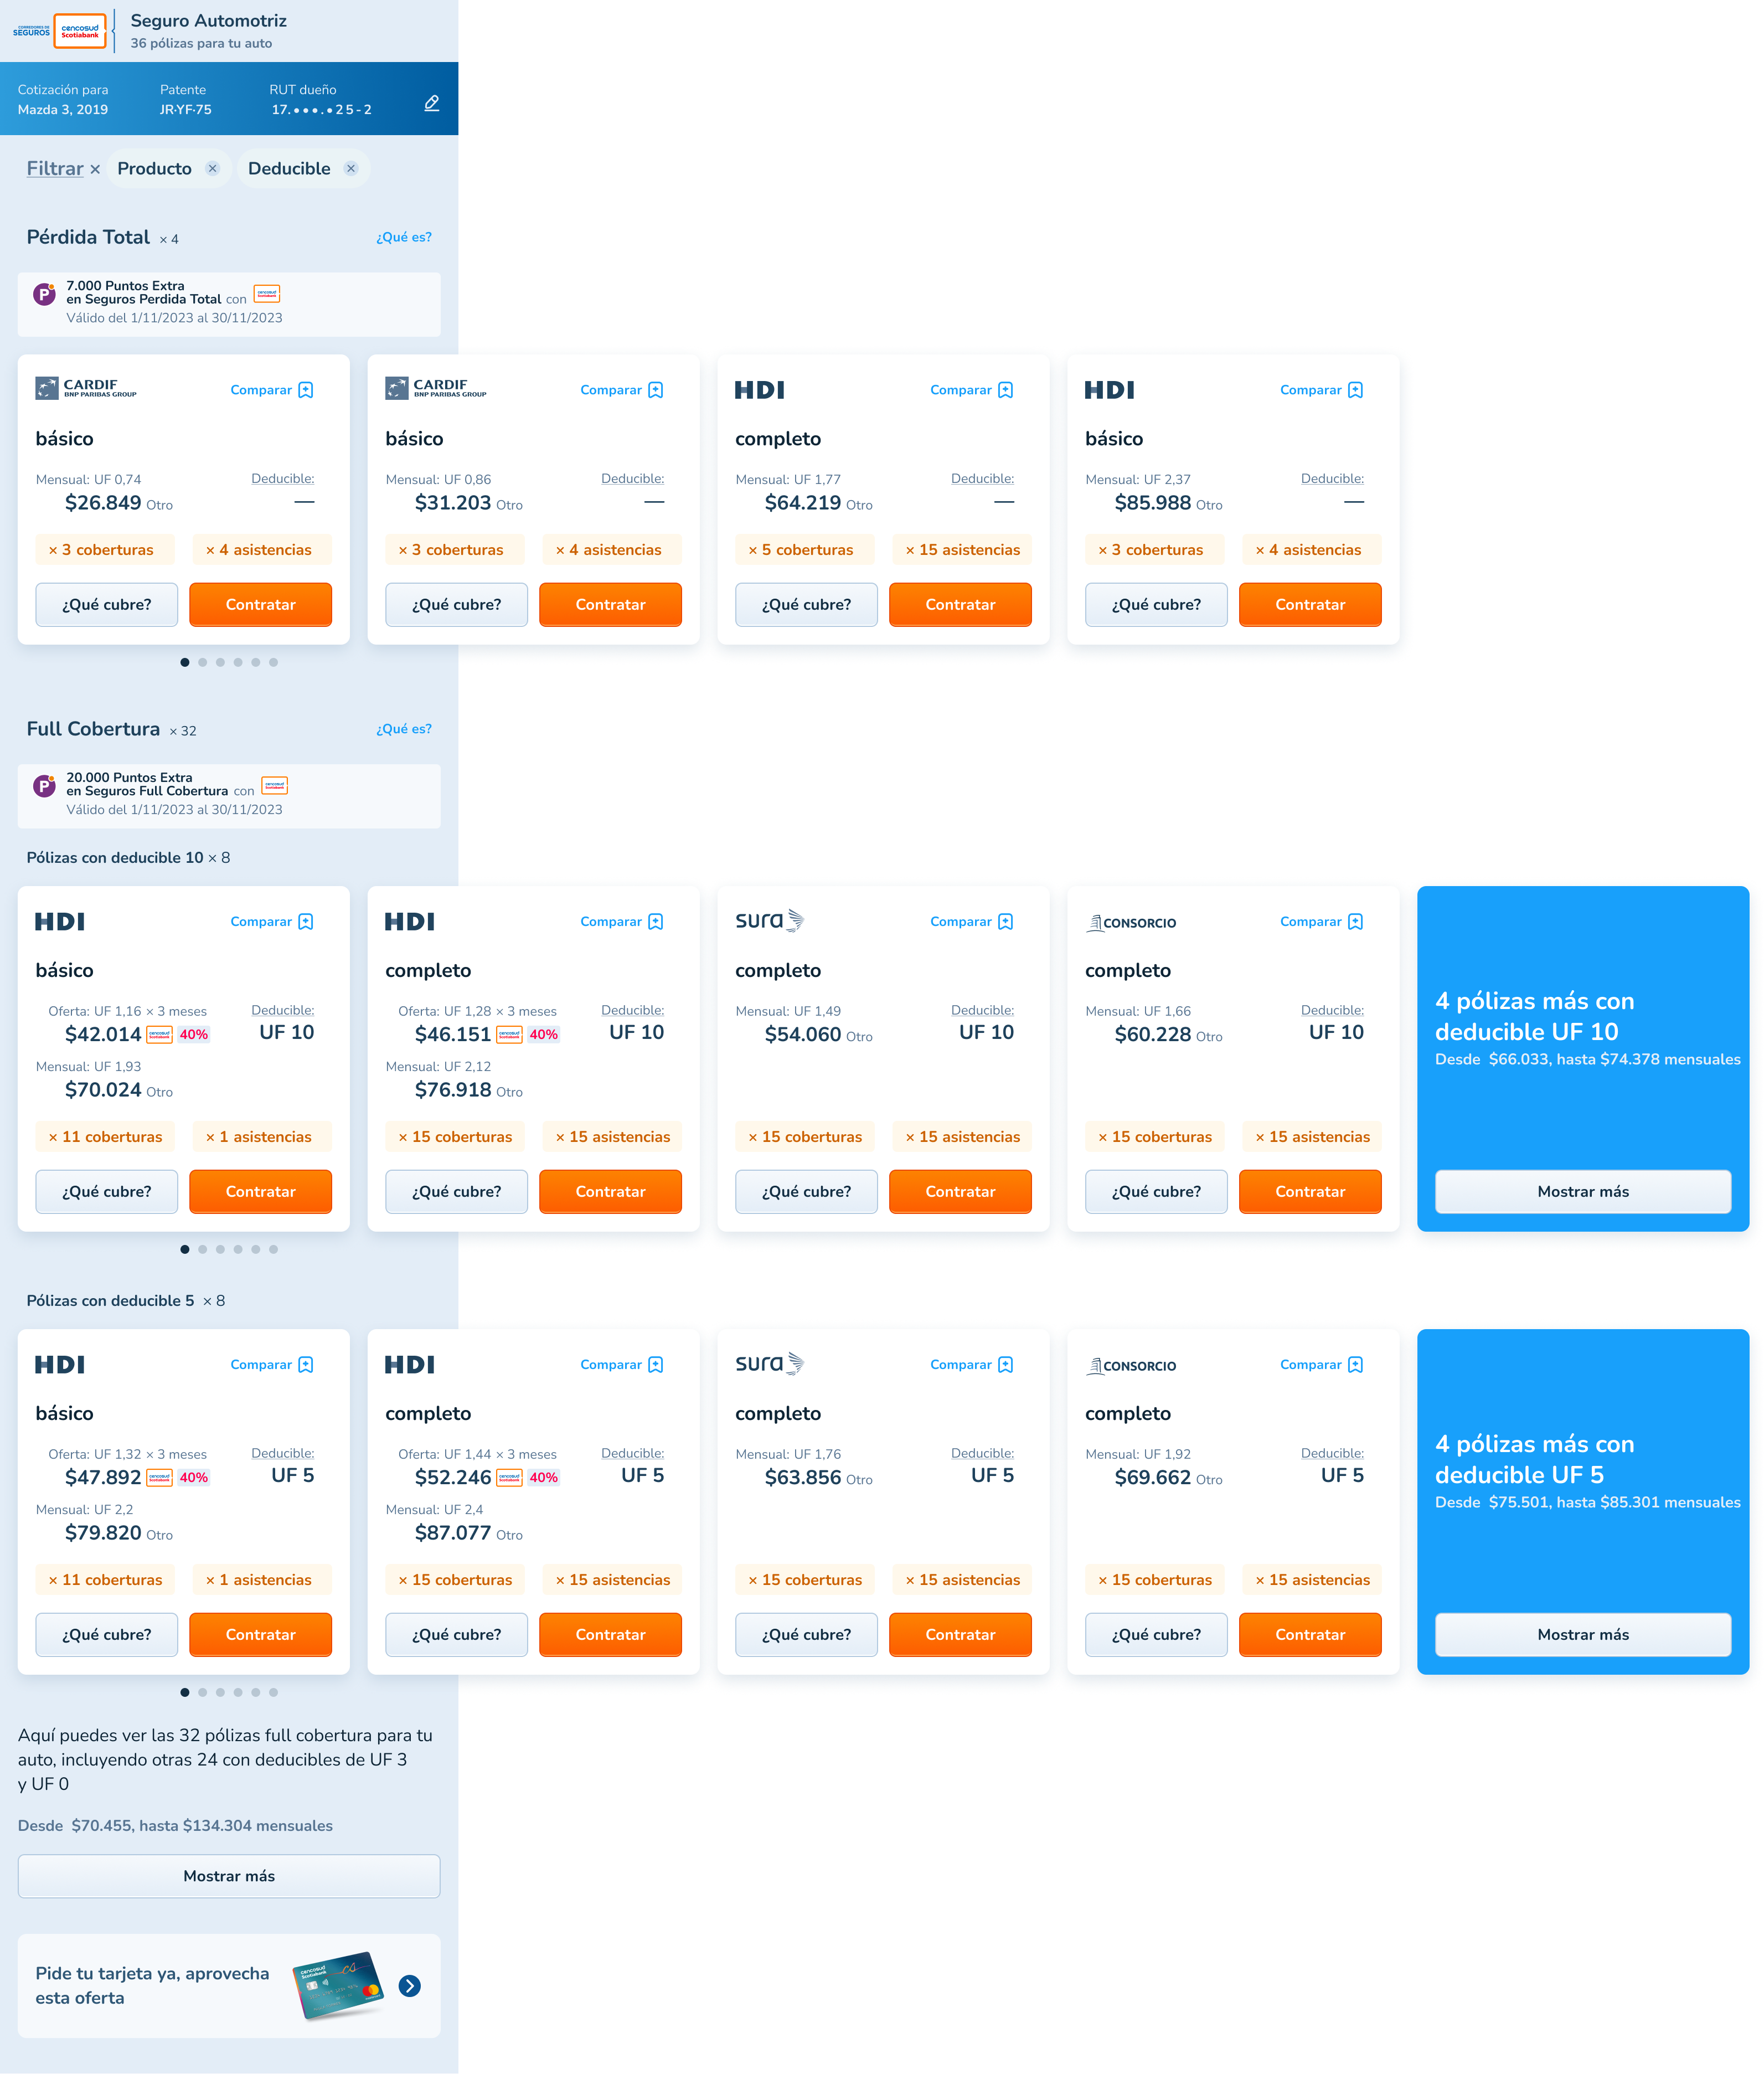
Mobile version
- Grouped by deductible and price
- Showed only the 4 best-selling per group
- Option to see all available
- Impact: 65% less cognitive load
Solution 3: Redesigned Cards

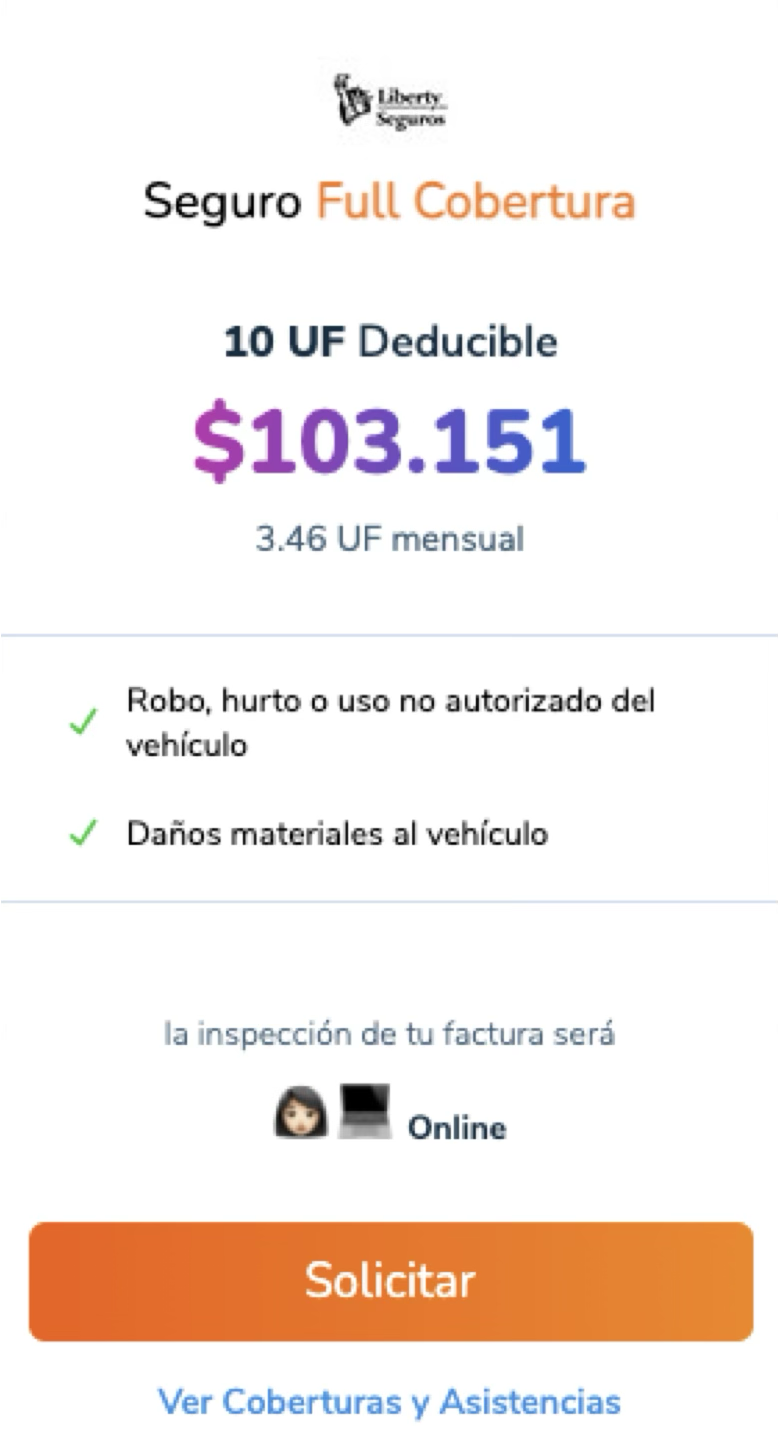
Tarjeta original
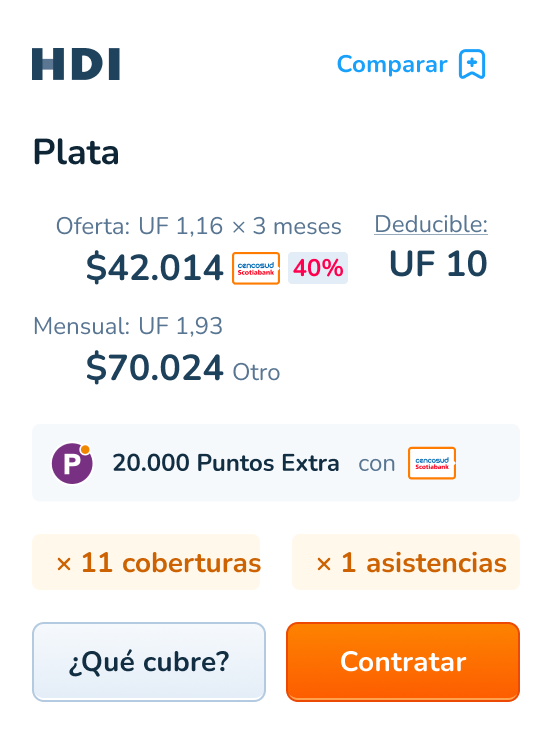
Tarjeta rediseñada con promoción
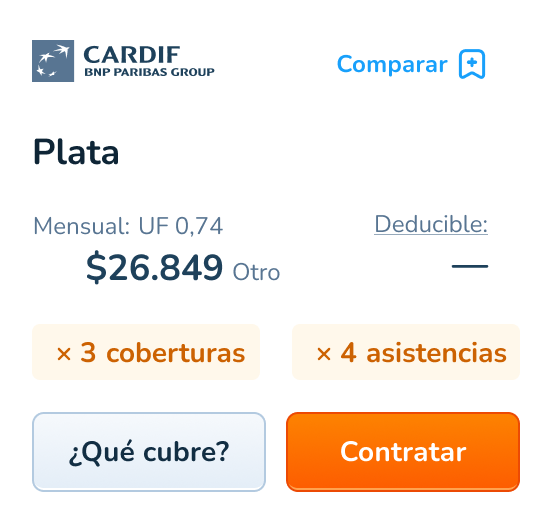
Tarjeta rediseñada simple
- Information prioritized according to user preferences
- Integrated explanations of technical terms
- Mobile-first design
5. Test: Iterative Validation
- 10 users tested navigation: successful
- Qualitative feedback revealed need to improve copy
- A/B testing validated each change before implementation
Results

I worked with Gabriel for two years with exceptional results”.
Pablo Poblete, CX Manager
(LinkedIn public comment)
Learnings
- Service Design reveals hidden problems: Mapping the entire journey showed internal competition between channels
- Objective frameworks accelerate decisions: RICE eliminated subjective discussions
- Fewer options = more conversions: Hick's Law was confirmed in insurance
- Multifaceted research is key: Combining quantitative and qualitative methods revealed unique insights
Contact me
Go to next case study


How did we reduce friction by 48% and increased conversions while simplifying complex decisions?
Finder
File
Edit
View
Go
Window
Help
seguroscencosud.cl


16:05
The Real Problem
Why would anyone want to see 34 nearly identical insurance options on their phone?”
This was my first question when I joined the team. The car insurance website had an 80% abandonment rate on the results page. Users saw 34 nearly identical options on mobile screens and left. It was obvious something was wrong, but nobody knew exactly what.


Spacer
My Methodology: Service Design + Design Thinking
1. Empathize: Research Beyond the Numbers
Instead of just looking at analytics, I applied a Service Design approach to understand the entire ecosystem:
Customer Journey Map
Competitive analysis
Mass surveys
In-depth interviews
Spacer
Complete Customer Journey Mapping
- Mapped the 11 key moments: from detecting the need to renewing or canceling
- Identified all touchpoints between the user and the company
- Discovered that other channels were competing for the same sale
Multifaceted Research
- Competitive analysis: 9 direct competitors + international references
- Mass surveys: 221 prospects + 337 current customers
- In-depth interviews: 12 people to define archetypes


Spacer
2. Define: Three User Types, Three Strategies
Three clear archetypes emerged from the research:

Archetypes definition
Pain points of the “hunter” archetype
Spacer
- Hunters (48%): Only care about price and speed
- Copilots (30%): Seek security and confirmation
- Scientists (22%): Need to understand all the details
Each group had specific pain points that required different solutions.


Spacer
3. Ideate: Objective Prioritization with RICE
To avoid subjective discussions about what to change first, I implemented the RICE framework:
Initiatives analyzed with the RICE methodology
Spacer
RICE = (Reach × Impact × Confidence) ÷ Effort
Result: 19 initiatives objectively prioritized, with “eliminating unnecessary screens” as issue #1 (RICE index: 10,464).
Spacer
4. Prototype: Modular Solutions
Solution 1: Simplified Flow (from 5 to 3 screens)
Adjustments to the flow
Spacer
- Used license plate as starting point
- Only asked for additional data if not in database
- Impact: 48% reduction in friction


Spacer
Solution 2: Hick's Law Applied (from 34 to 12 options)
Desktop version
Mobile version
Spacer
- Grouped by deductible and price
- Showed only the 4 best-selling per group
- Option to see all available
- Impact: 65% less cognitive load


Spacer
Solution 3: Redesigned Cards
Tarjeta original
Tarjeta rediseñada con promoción
Tarjeta rediseñada simple
Spacer
- Information prioritized according to user preferences
- Integrated explanations of technical terms
- Mobile-first design
Spacer
5. Test: Iterative Validation
- 10 users tested navigation: successful
- Qualitative feedback revealed need to improve copy
- A/B testing validated each change before implementation
Results
48%
reduction in flow friction
65%
less cognitive load in results
I worked with Gabriel for two years with exceptional results”.
Pablo Poblete, CX Manager
(LinkedIn public comment)
Learnings
- Service Design reveals hidden problems: Mapping the entire journey showed internal competition between channels
- Objective frameworks accelerate decisions: RICE eliminated subjective discussions
- Fewer options = more conversions: Hick's Law was confirmed in insurance
- Multifaceted research is key: Combining quantitative and qualitative methods revealed unique insights


Spacer
Contact me
Go to next case study